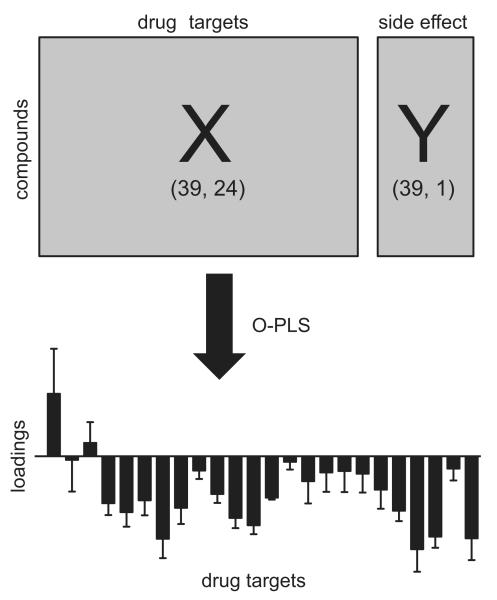
Figure 2.
Statistical approach for relating binding affinity profiles to clinically reported adverse drug reactions (ADRs). Elements of the X matrix represent binding affinities (pKi values) for 39 psychotropic medications comprising 24 drug targets. Elements of the Y vector represent frequencies of a single ADR reported in clinical trials of these 39 psychotropic medications. For each specific ADR (n=22) a separate orthogonal projection to latent structures (O-PLS) model was calculated. Principal component 1 (p[1]) loadings plots were used to interpret the relationship between drug target interactions and ADR frequencies. Positive p[1] loadings indicate that binding affinities correlate positively with the Y variable (frequency of ADR), whereas negative p[1] loadings indicate a negative correlation. p[1] loadings close to zero demonstrate the absence of any correlation between binding affinities and ADR frequencies.

