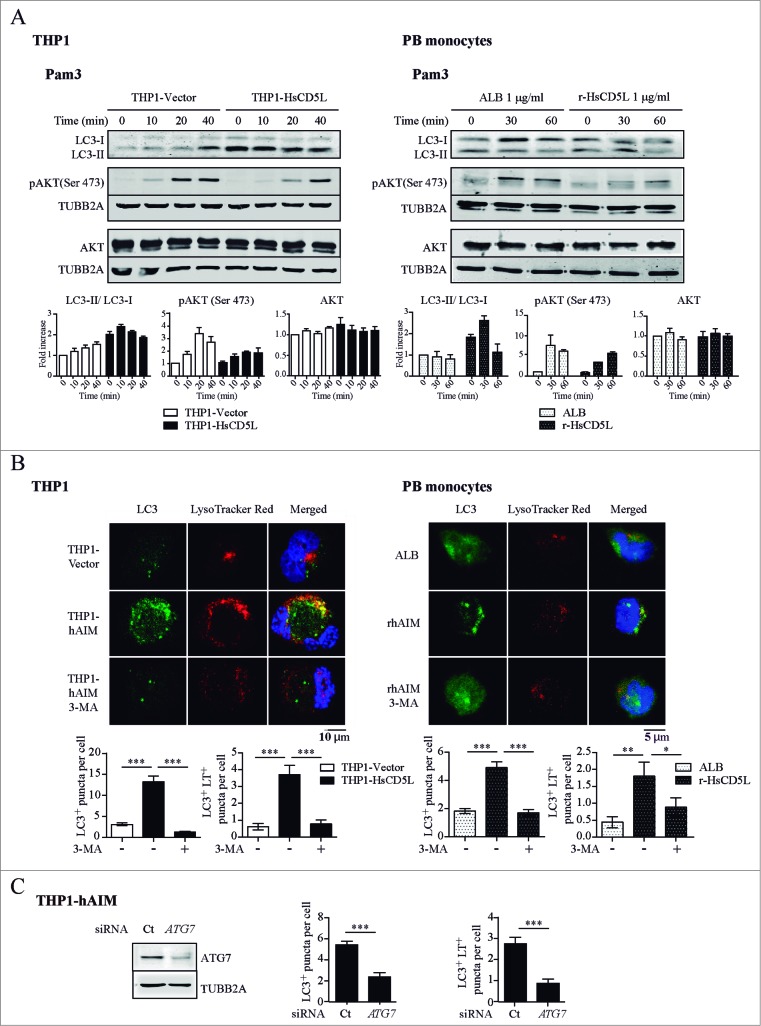
Figure 4.
(See previous page). CD5L promotes macrophage autophagy. (A) THP1 MФ (left) and PB monocytes (right) preincubated with 1 μg/ml r-HsCD5L or ALB for 24 h were stimulated with 0.5 μg/ml Pam3CSK4 for the indicated times, lysed, and probed in western blots with specific antibodies. Upper panel: Western blot images of a single experiment. Lower panel: mean of protein signal intensities ± SEM of 3 independent experiments. Fold increase is relative to untreated THP1-Vector MФ (left) and untreated PB monocytes (right) after normalization to the control protein TUBB2A. LC3 protein signal intensities were plotted as LC3-II/LC3-I ratio. (B) To determine autophagy flux, THP1 MФ (left) and PB monocytes (right) preincubated with 1 μg/ml r-HsCD5L or ALB for 24 h were treated for 45 min with autophagy inhibitor 3-MA (3-MA, 0.1 mM), or with DMSO used as a control. LC3 was then stained with a specific antibody (green), acidic organelles with LysoTracker Red (red), and nuclei with Hoechst dye (blue). Upper panel: representative confocal microscopy images showing LC3 and LysoTracker Red staining and colocalization (Merged). Lower Panel: mean ± SEM quantitative data showing LC3 puncta per cell (LC3+ puncta per cell) and LC3-LysoTracker Red colocalized puncta per cell (LC3+ LT+ puncta per cell) in 3 independent experiments (for THP1 MФ) or 3 blood donors, including at least 50 cells scored in random fields. (C) (Left) Western blot analysis of ATG7 protein silencing in THP1-HsCD5L MФ after transfection of a siRNA targeting ATG7 (ATG7) or a nontargeting negative control (Ct). Detection of TUBB2A was used as a measure of equal loading. Silenced MФ were then stained for LC3, LysoTracker Red and nuclear detection as in B). (Right) Graphs depict mean ± SEM quantitative data showing LC3 puncta per cell (LC3+ puncta per cell) and LC3-LysoTracker Red colocalized puncta per cell (LC3+ LT+ puncta per cell) in 3 independent experiments, including at least 200 cells scored in random fields. *P ≤ 0.05; **P ≤ 0.01; ***P ≤ 0.001, one-way ANOVA.

