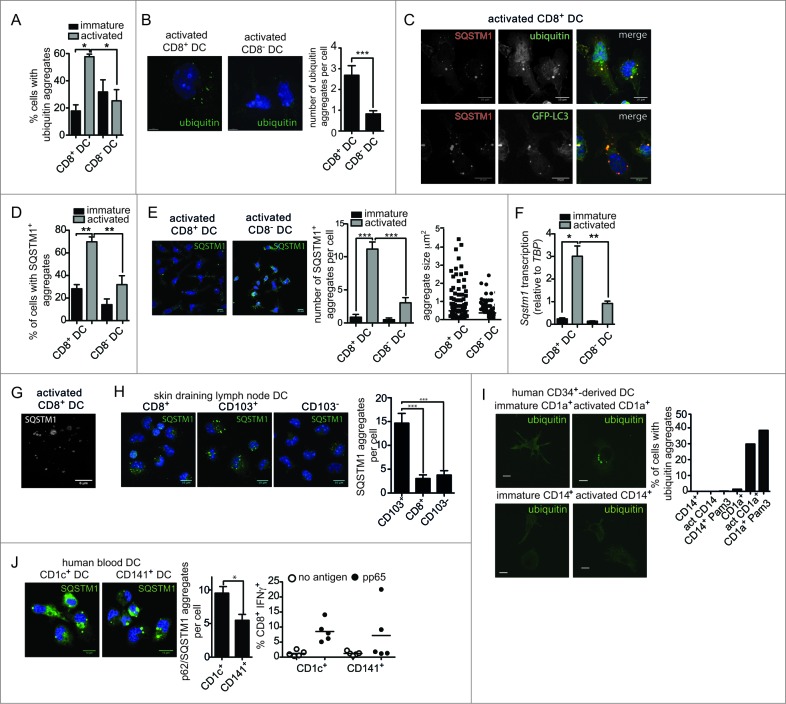
Figure 2.
Increased ubiquitin and SQSTM1 receptor aggregates following activation of mouse and human cross-presenting DC. (A) Ubiquitinated proteins were detected in freshly isolated (immature) spleen CD8+ DC and CD8− DC, or following overnight activation (activated) by imaging flow cytometry. Data were pooled from 2 or 3 independent experiments, mean ± 1 SEM, *P ≤ 0.05, one-way ANOVA with Tukey multiple comparison test. (B) Splenic CD8+ DC and CD8− DC were activated by culture overnight. DC were stained with an anti-mono and polyubiquitin specific antibody, nuclei were counterstained with DAPI and cells imaged by structured illumination microscopy (SIM). Scale bar: 5 μm. Number of ubiquitinated aggregates per cell was scored from SIM images for 19 activated CD8+ DC and 17 activated CD8− DC, mean ± 1 SEM, ***P ≤ 0.001, Mann Whitney t test. (C) Spleen wild-type or GFP-LC3 CD8+ DC were purified by flow cytometry and cultured overnight (activated). Cells were stained for ubiquitin or SQSTM1, counterstained with DAPI and imaged by confocal microscopy; scale bar: 10 μm. (D) Spleen CD8+ DC and CD8− DC were cultured at 4°C (immature) or 37°C overnight (activated), stained for SQSTM1 and analyzed by imaging flow cytometry. Data were pooled from 2 or 3 independent experiments, mean ± 1 SEM, **P ≤ 0.01, one-way ANOVA with Tukey multiple comparison test. (E) Spleen CD8− DC and CD8+ DC were activated overnight and stained for SQSTM1 and nuclear dye DAPI and imaged by confocal microscopy; scale bar: 10 μm. Graph displays number of cells containing SQSTM1 aggregates. Data are from 96 CD8+ DC, 111 CD8− DC scored in 4 independent experiments, mean ± 1 SEM, ***P ≤ 0.001, one-way ANOVA with Tukey multiple comparison test. SQSTM1 aggregate size (μm2) measured from 291 aggregates in activated CD8− DCs and 232 aggregates in activated CD8+ DCs. (F) Splenic CD8+ DC and CD8− DC were purified by flow cytometry. Cells were examined directly ex vivo (immature) or following activation by culture at 37°C overnight (activated). RNA was isolated and quantitative real time PCR performed to measure Sqstm1 transcription, relative to the housekeeping gene Tbp. Data are mean ± 1 SEM, pooled from 3 independent experiments, *P ≤ 0.05, one-way ANOVA with Tukey multiple comparison test. (G) Spleen CD8+ DCs were purified by flow cytometry and activated by culture overnight. Cells were stained for SQSTM1 and examined by SIM; scale bar: 6 μm. (H) CD8+ DC, CD103+ DC and CD103− DC isolated from skin-draining lymph nodes were stained for SQSTM1, counterstained with DAPI and imaged by confocal microscopy; scale bar: 10 μm. Graph represents data from 27 CD8+ DC, 32 CD103+ DC and 26 CD103− DC, mean ± 1 SEM ***P ≤ 0.001. (I) CD1a+ and CD14+ human DC were analyzed immediately after isolation (immature) or following overnight culture (activated) for mono and polyubiquitinated proteins by confocal microscopy; scale bar: 10 μm. Graph displays proportion of CD1a+ and CD14+ DC containing ubiquitin aggregates for DC that were freshly isolated, culture overnight (act) or stimulated overnight in presence of 1 μg/ml Pam3-CSK4 (Pam3) (n > 350 cells). (J) Human CD1c+ and CD141+ DC were imaged for SQSTM1 aggregates by confocal microscopy; scale bar: 16 μm. Left graph: represents 59 CD1c+ DC and 33 CD141+ DC, mean ± 1 SEM *P ≤ 0.05, Mann Whitney t test. Right graph: human CD1c+ and CD141+ DC were pulsed with cytomegalovirus pp65 protein and MHC I cross-presentation of the pp65495–503 epitope measured by IFNG secretion by pp65495–503-specific CD8+ T cells. Data were pooled from 5 individual donors.

