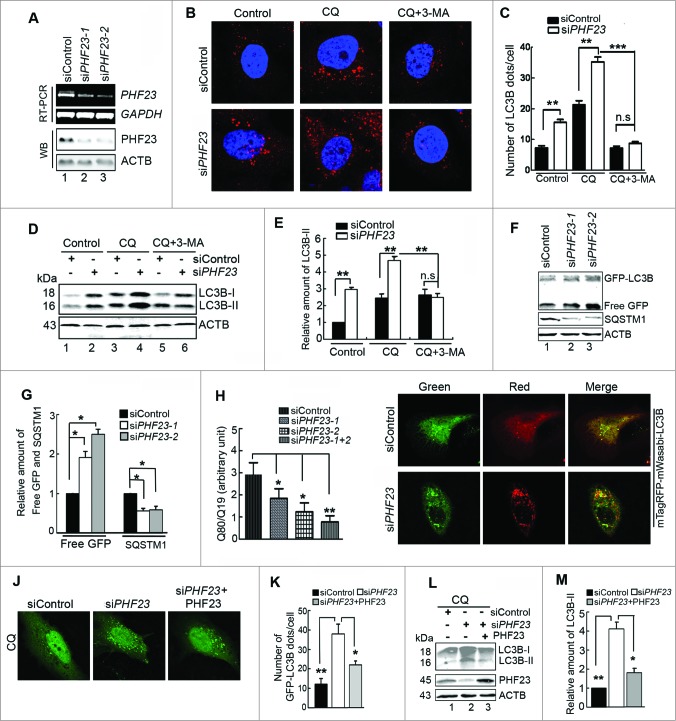
Figure 3 (see previous page).
Knockdown of PHF23 increases autophagic flux. (A) U2OS cells were transfected with siControl, siPHF23-1 or siPHF23-2 for 48 h. PHF23 mRNA or protein expression was detected by RT-PCR and western blot, respectively. (B) Representative confocal microscopy images of endogenous LC3B distribution in U2OS cells transfected with siControl or siPHF23 for 48 h and treated with CQ (25 μM) for the last 4 h and/or 10 mM 3-MA for the last 6 h. (C) Quantification of endogenous LC3B dots in siControl or siPHF23 cells treated with reagents as indicated in (B). Data are means ± SD of at least 100 cells scored (**P < 0.01, ***P < 0.001). (D) Western blot analysis of endogenous LC3B-II levels in U2OS cells treated as in (B). (E) Quantification of amounts of LC3B-II relative to ACTB in cells treated as in (D). Average value in siControl-transfected cells without CQ treatment was normalized as 1. Data are means ± SD of results from 3 experiments (**P < 0.01). (F) HeLa cells stably expressing GFP-LC3B were cotransfected with siControl, siPHF23-1, or siPHF23-2 for 48 h. Levels of SQSTM1 and free GFP were analyzed by protein gel blot. (G) Quantification of amounts of SQSTM1 protein or free GFP relative to ACTB in cells treated as in (F). The average value in siControl-transfected cells was normalized as 1. Data are means ± SD of results from 3 experiments (*P < 0.05). (H) U2OS cells were cotransfected with polyQ80-luciferase (or polyQ19-luciferase) and the indicated siRNAs for 48 h. PolyQ80–luciferase/polyQ19-luciferase ratios were analyzed using the Dual Luciferase Reporter System (*P < 0.05, **P < 0.01). (I) Representative confocal microscopy images of mTagRFP-mWasabi-LC3B distribution in U2OS cells cotransfected with mTagRFP-mWasabi-LC3B and siControl or siPHF23 and cultured for 48 h. (J) Representative confocal microscopy images of GFP-LC3B distribution in U2OS cells cotransfected with different combinations for 48 h, and treated with CQ (25 μM) for the last 4 h. (K) Quantification of GFP-LC3B dots in U2OS cells treated as in (J). Data are means ± SD of at least 100 cells scored (*P < 0.05, **P < 0.01). (L) Western blot analysis of endogenous LC3B-II levels in U2OS cells treated as in (J). (M) Quantification of endogenous LC3B-II levels relative to ACTB in cells treated as in (L). The average value in siControl-transfected cells was normalized as 1. Data are means ± SD of results from 3 experiments (*P < 0.05, **P < 0.01).

