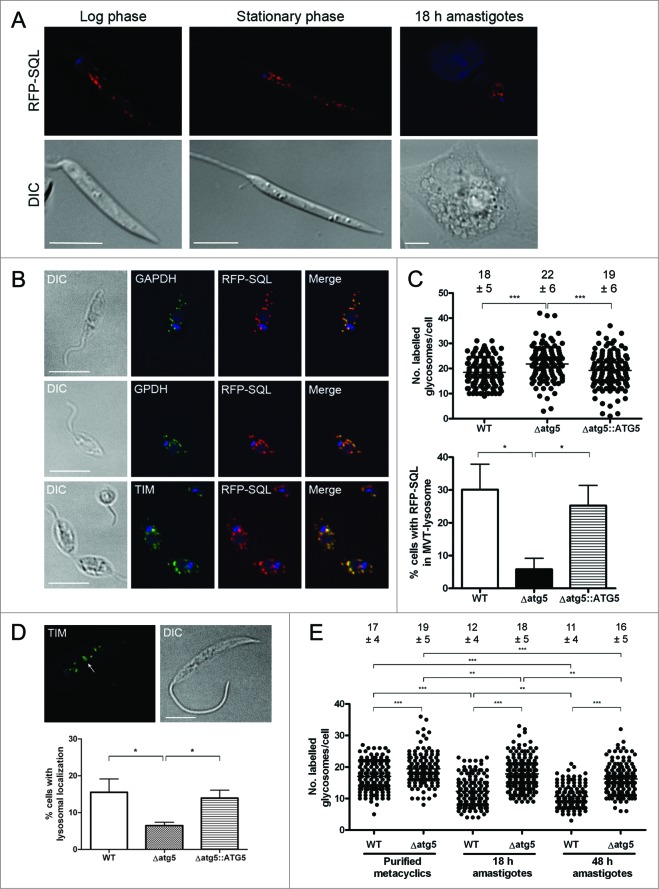
Figure 1 (See previous page).
Comparison of glycosome numbers in WT and Δatg5 mutants. (A) L. major expressing RFP-SQL were imaged by fluorescence microscopy. Scale bar = 5 μm. (B) L. major expressing RFP-SQL were fixed and permeabilized, then probed with primary antibodies to various glycosomal enzymes. After addition of Alexa Fluor 488-conjugated secondary antibody, cells were mounted in VectaShield with DAPI and imaged by fluorescence microscopy. Scale bar = 10 μm. (C) Top: The number of glycosomes per cell was counted for at least 150 stationary phase promastigotes for each cell line. Below: The percentage of cells with MVT-lysosomes containing RFP-SQL. (D) Top: Immunofluorescence analysis of L. major promastigotes using anti-TIM antibodies. Arrow shows localization of anti-TIM to MVT-lysosome. Scale bar = 5 μm. Below: The percentage of cells containing MVT-lysosomes labeled by anti-TIM antibody. (E) Purified metacyclic promastigotes were used to infect murine peritoneal macrophages. Glycosomes per cell were counted in metacyclic promastigotes, and in parasites within macrophages either 18 or 48 h after infection. The number of glycosomes per cell was counted for at least 150 cells for each cell line at each time point. On scatter plots, each spot represents a single measurement with the horizontal line representing the mean. The mean ± standard deviation is included above each dataset. On bar charts, bars show mean of 3 independent experiments with error bars showing standard deviation. All data were analyzed using a one-way ANOVA with a Tukey-Kramer multiple comparison test. *** denotes P < 0.001, ** P < 0.01 and * P < 0.05.

