Figure 2.

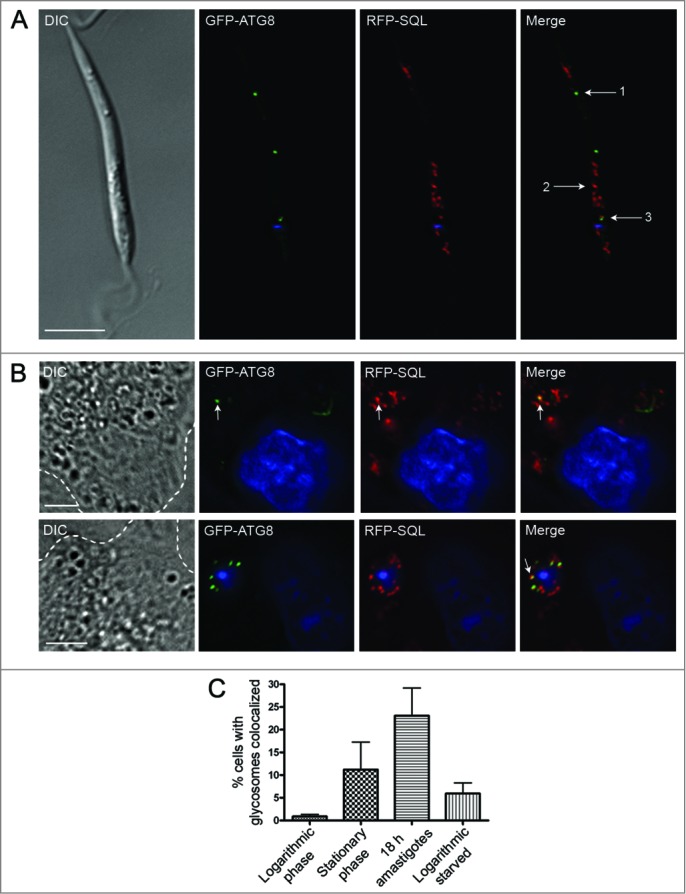
Analysis of glycosomes colocalized with autophagosomes. (A) L. major promastigotes coexpressing GFP-ATG8 (to label autophagosomes green) and RFP-SQL (to label glycosomes red) were DAPI-stained, washed and resuspended in PBS before live-cell imaging. The Pearson coefficient (r) represents the degree of colocalization between GFP-ATG8 and RFP-SQL. Arrows show examples of analysis of various structures: 1. GFP-ATG8 labeled autophagosome, r = 0.08. 2. RFP-SQL-labeled glycosome, r = 0.28. 3. GFP-ATG8 and RFP-SQL colocalization, r = 0.69. Scale bar = 5 μm. (B) Purified L. major metacyclic promastigotes coexpressing GFP-ATG8 and RFP-SQL were used to infect murine peritoneal macrophages. 18 h after infection, cells were stained with DAPI before live-cell imaging. Arrows show colocalization (r = 0.77 and r = 0.73 in upper and lower panels respectively). Images show a single slice from a 3-μm Z stack. Scale bar = 5 μm. Dashed lines show edges of macrophages. (C) Quantification of autophagosome-glycosome colocalization through the L major life cycle. The percentage of cells containing at least one GFP-ATG8-labeled autophagosome, and autophagosome-glycosome colocalization data (Table S2) were used to calculate the percentage of the population in which autophagosomes colocalized with glycosomes at any given time. Bars represent the mean and error bars the standard deviation of data from multiple experiments. A summary of these data can be found in Table S1.
