Figure 6.
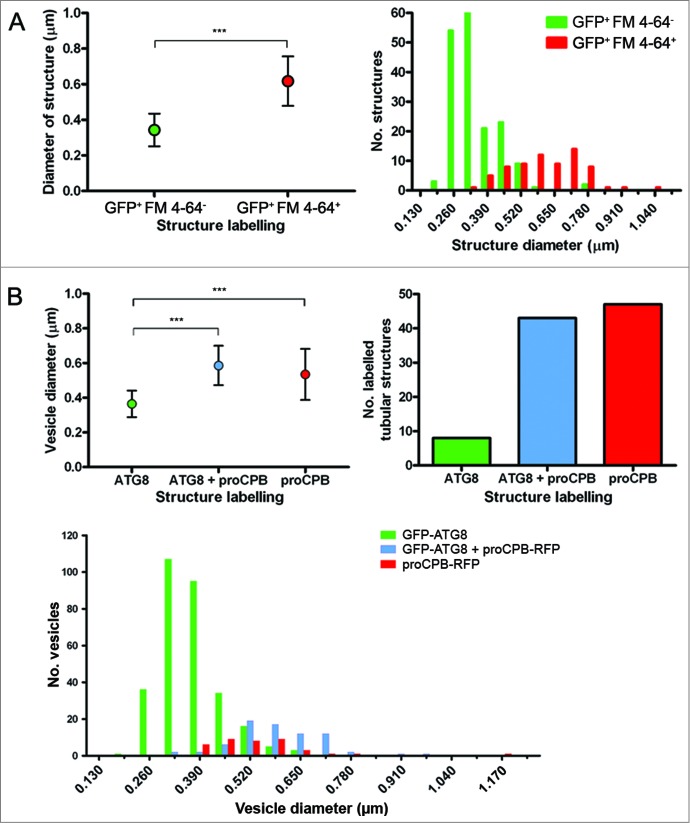
Characterization of vesicle size in L. major during stationary phase. (A) L. major expressing GFP-ATG8 were incubated with 40 μM FM 4–64 for 1 h to stain the lysosomal compartment, before imaging. Left: Average vesicle size. Dots represent the mean and the error bars standard deviation. Right: Frequency distribution of vesicle sizes. (B) L. major coexpressing GFP-ATG8 and proCPB-RFP. Left: Average vesicle size. Dots represent the mean and the error bars standard deviation. Right: Numbers of tubular compartments labeled with GFP-ATG8, proCPB-RFP or both. Bottom: Frequency distribution of vesicle sizes. Vesicle sizes were measured using SoftWoRx Explorer Image analysis software. Data were analyzed using the Student t test (for 2 samples; A) or one-way ANOVA with a Tukey-Kramer multiple comparison test (for 3 samples; B). Frequency distribution data were binned by 0.065 μm intervals, which correspond to the limit of measurement accuracy based on the microscopy image pixels. *** denotes P < 0.001.

