Figure 7.
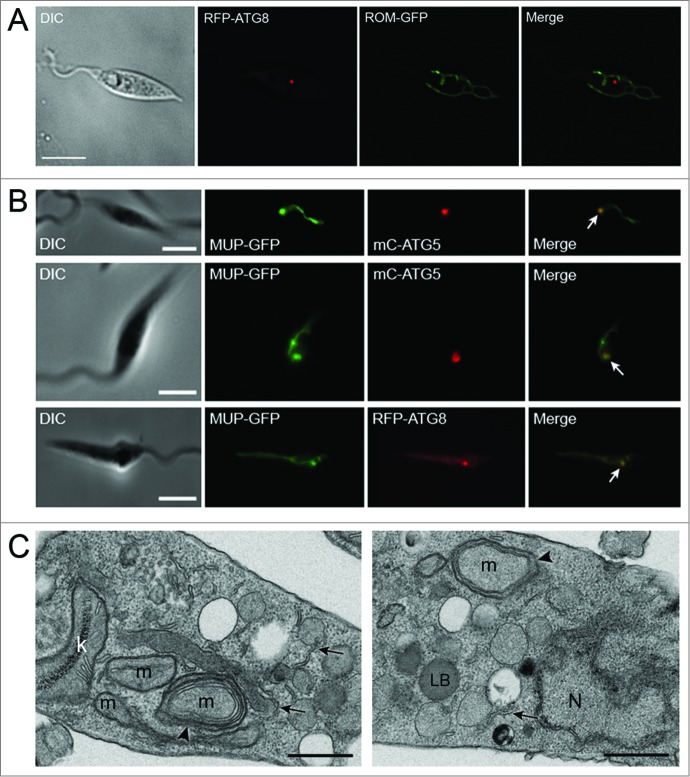
Analysis of autophagy and the mitochondrion during normal growth and starvation. (A) Stationary phase L. major promastigotes coexpressing RFP-ATG8 and ROM-GFP. (B) The occurrence and colocalization of mC-ATG5 or RFP-ATG8 puncta and MUP-GFP coexpressed in log phase WT L. major promastigotes after 4 h in PBS at 25°C. RFP-ATG8 or mC-ATG5 puncta colocalizing with MUP-GFP are arrowed. Images show a single slice from a 3-μm Z stack. Scale bar = 5 μm. (C) TEM. Ultrathin sections of L. major promastigotes after starvation in PBS. Arrowheads mark double-membrane vesicles formed around pieces of mitochondrion. Arrows mark ER profiles which may represent forming autophagic membranes. K, kinetoplast; LB, lipid body; m, mitochondrion; N, nucleus. Scale bars = 0.5 μm.

