Figure 8.
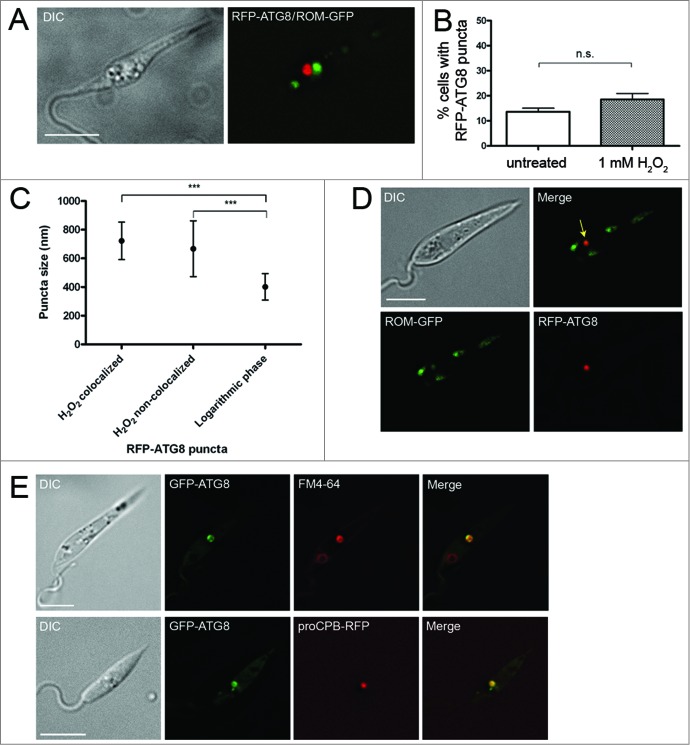
Analysis of autophagy during H2O2-induced mitochondrial fragmentation. (A) Log phase L. major coexpressing RFP-ATG8 and ROM-GFP were incubated with 1 mM H2O2 for 1 h at 25°C. (B) Percentage of cells exhibiting one or more RFP-ATG8 puncta was determined by counting 200 treated and 200 untreated cells per experiment. Bars show mean and error bars standard deviation of 4 independent experiments. Data were analyzed using a Student t test; n.s. not significant. (C) Puncta sizes were measured using SoftWoRx Explorer Image Analysis software. Data were analyzed using one-way ANOVA with a Tukey-Kramer multiple comparison test. *** signifies P < 0.001. (D) Parasites were prepared as in A. Colocalization analysis was performed using SoftWoRx Image Analysis software. Arrow marks colocalization. (E) L. major expressing GFP-ATG8 were incubated with 40 μM FM 4-64 for 1 h before H2O2 treatment as above. Microscopy images show a single slice from a 3-μm Z-stack. Scale bar = 5 μm.

