
Figure 6.
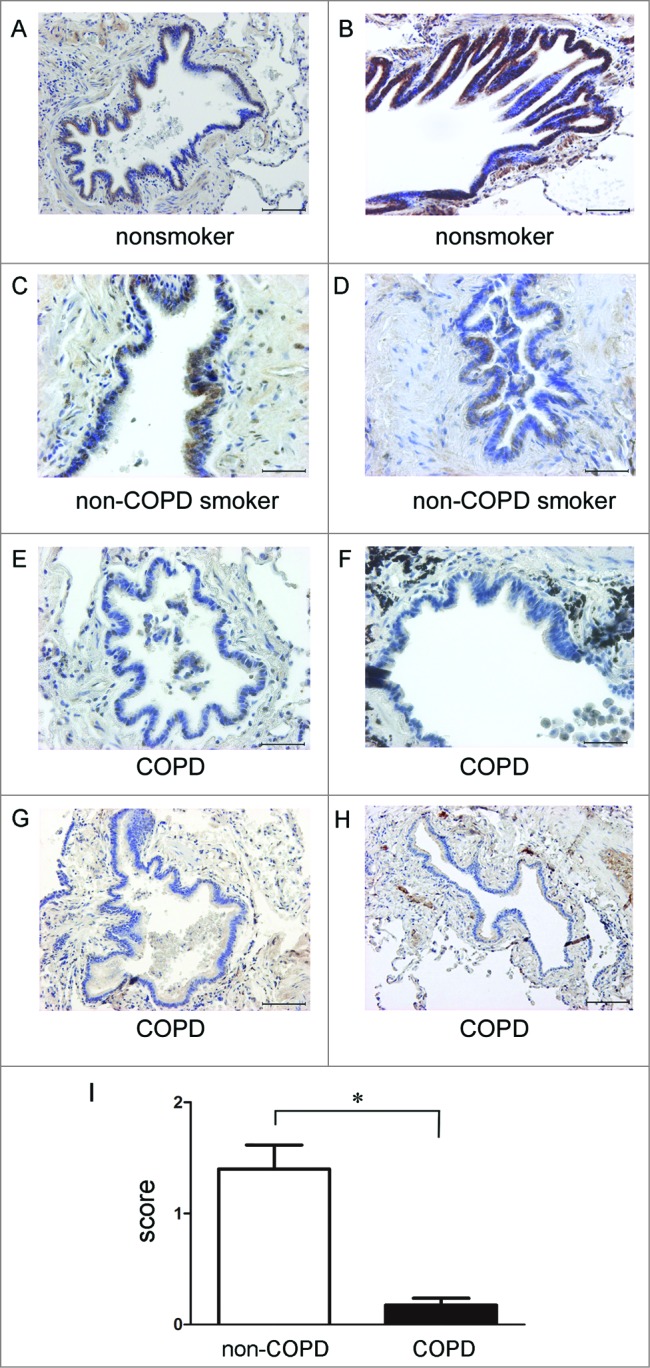
PARK2 expression in normal and COPD lung tissues. Immunohistochemical staining of PARK2 in nonsmoker, non-COPD smoker, and COPD lung tissues: Photomicrographs of small airway in nonsmoker (A and B), non-COPD smoker (C and D), and COPD lungs (E to H). Bar: 100 μm in A, B, G, H. Bar = 50 μm in C, D, E, F. (I) Shown is the average of semiquantitative score (±SEM) of PARK2-positive cells in small airway epithelial cells. Open bar is non-COPD (n = 4, total 18 small airways) and filled bar is COPD (n = 4, total 16 small airways). *P < 0.05.