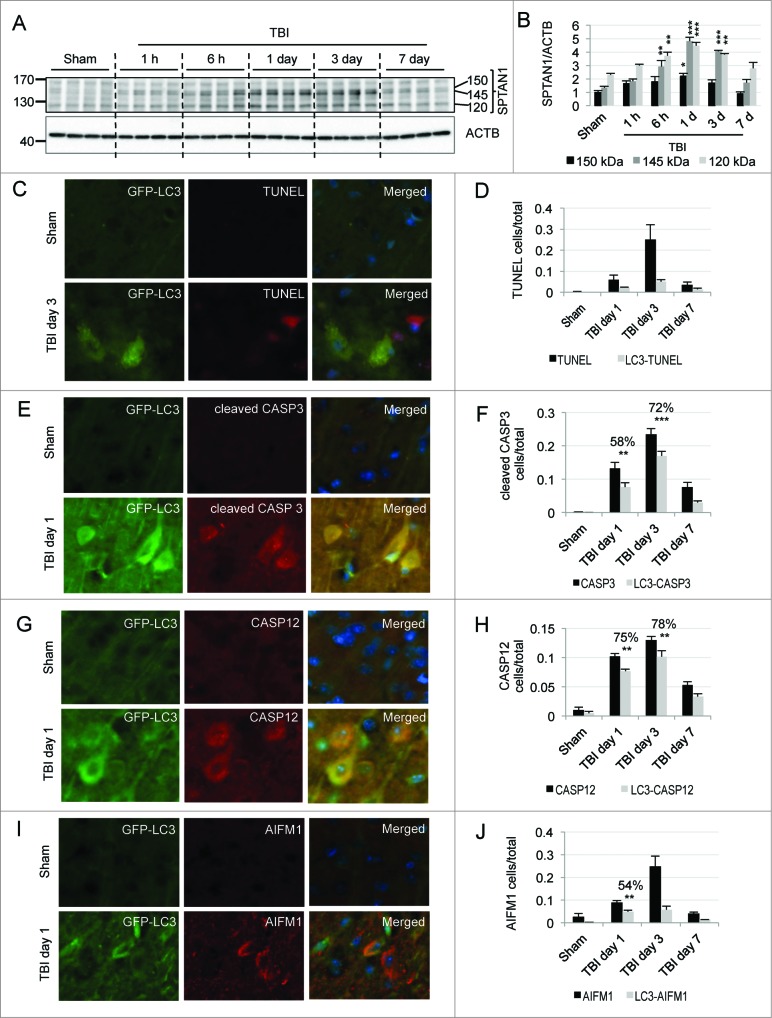
Figure 5.
Impairment of autophagy after TBI contributes to neuronal cell death. (A) Western blot analysis of SPTAN1 breakdown products of 150 kDa, 145 kDa, and 120 kDa in cortical tissue from sham and TBI mouse brain. (B) Corresponding densitometric analysis of SPTAN1 bands with respect to ACTB. n = 4, *P < 0.05, **P < 0.01, ***P < 0.001. (C, E, G) Images (20×) of GFP-Lc3 mouse cortical brain sections from sham and TBI mice stained for cell death markers: TUNEL (C), cleaved CASP3 (E), CASP12 (G) and AIFM1 (I). Corresponding quantification of cells single positive for indicated cell death markers (black bars) and double positive for GFP-LC3 (gray bars) and TUNEL (D), Cleaved CASP3, **P < 0.01, ***P < 0.001 (F), CASP12, P < 0.001 at both d 1 and 3 (H), and AIFM1, P < 0.001 (J). The percentages of double-positive versus single-positive cells are indicated at the most significant time points. n = 3; data are represented as mean ± SE.

