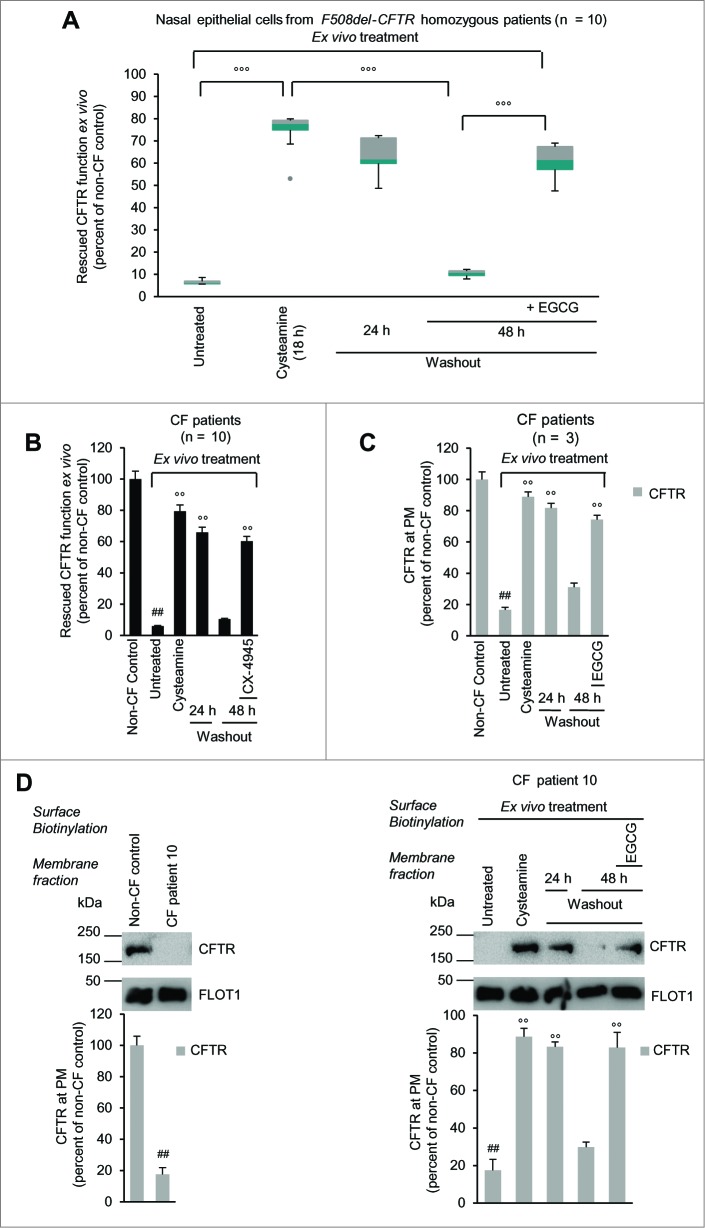
Figure 4.
Effects of cysteamine and EGCG on surface CFTR in ex vivo cultured primary human nasal epithelial cells belonging to the enrolled F508del-CFTR homozygous CF patients. Freshly isolated brushed nasal epithelial cells were collected from 10 F508del-CFTR homozygous patients and cultured for 18 h with or without cysteamine (250 μM) and then kept for 24 or 48 h in medium or medium added with EGCG (80 μM). Brushed nasal epithelial cells from 5 non-CF healthy controls were cultured with medium alone. (A) Assessment of iodide efflux by a fluorescence assay (SPQ) upon stimulation with forskolin (Fsk) plus 3-Isobutyl-1-methylxanthine (IBMX). Rate of iodide efflux, expressed as percentage of values of 5 healthy controls. The analysis was performed on at least 50 cells per sample and per experiment. Mean ± SD of 3 experiments for each sample. °°°P < 0.001 (ANOVA). (B) Effect of incubation with CX-4549, instead of EGCG, during cysteamine washout. Assessment of iodide efflux. Mean ± SD of 3 experiments for each sample. °°P < 0.01 (ANOVA). (C and D) Effects of ex vivo treatment on CFTR protein levels at the PM of nasal epithelial cells. (C) Mean values of residual CFTR protein at the PM of patients No. 5, 6, and 10 of Table 1. The values are expressed as percentage of non-CF healthy control (considered as 100% of value). Mean values of 3 independent experiments for each sample; °°P < 0.01 compared to untreated, ##P < 0.01 compared to non-CF healthy control (ANOVA). (D) Left, representative blot of CFTR protein levels at the PM of nasal epithelial cells from one out of 5 non-CF control and one patient (No. 10 of Table 1) out of 3 patients analyzed. Right, representative blot of CFTR protein levels at the PM of nasal epithelial cells from patient No. 10 cultured ex vivo as indicated. Top, surface biotinylation followed by purification of streptavidin-bound PM proteins and immunoblot with anti-CFTR (clone CF3, Abcam). FLOT1 confirmed cell surface protein-specific localization. Bottom, densitometric measurement of the residual CFTR at the PM expressed as percentage of non-CF healthy control (100% of value) normalized to FLOT1 levels. Mean ± SD of triplicates of independent experiments; °°P < 0.01 compared to untreated, ##P < 0.01 compared to non-CF healthy control (ANOVA).

