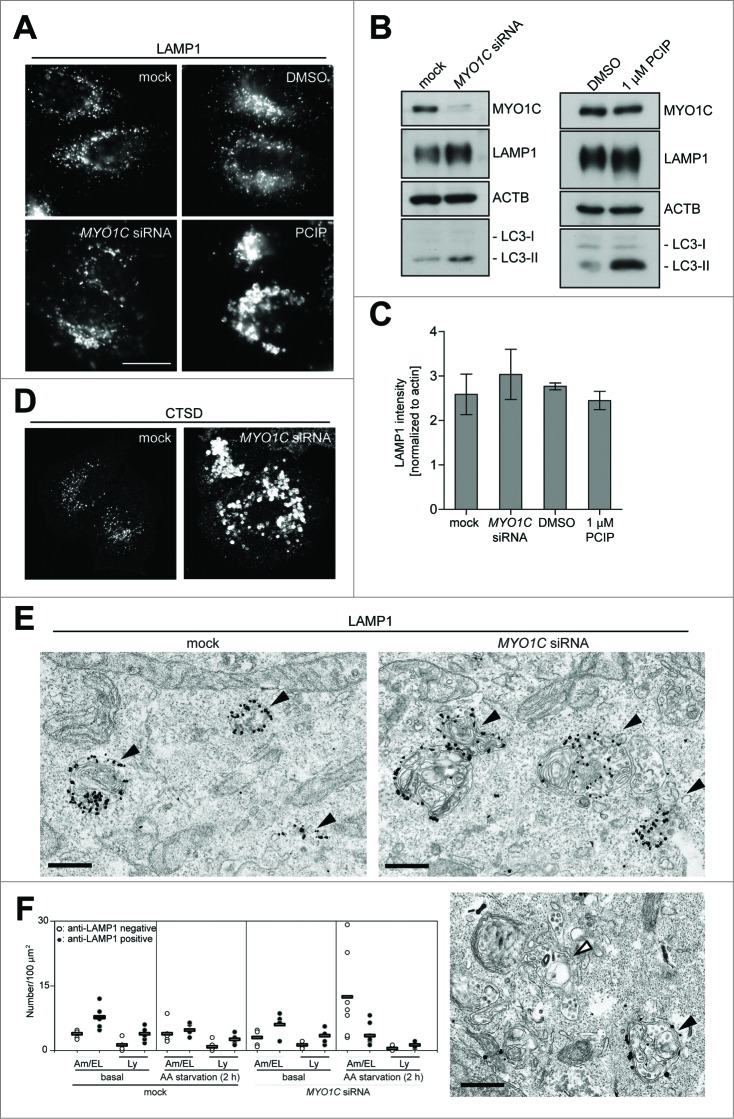
Figure 5.
Effect of MYO1C knockdown on lysosome morphology. HeLa cells were either mock treated or transfected with MYO1C siRNA or incubated for 16 h with the MYO1 inhibitor PClP or equivalent amounts of DMSO as control before processing for confocal microscopy (A, D) or western blot analysis (B) using antibodies against the lysosomal marker proteins LAMP1 or the lysosomal protease CTSD. Bar = 10 μm. (C) Quantification of LAMP1 protein levels from protein gel blots following MYO1C siRNA depletion or PCIP treatment. Results represent the mean (+/− s.d.) from >3 independent experiments. (E) Mock-treated or MYO1C siRNA KD cells in complete medium were labeled for immuno-electron microscopy using anti-LAMP1 antibodies. Black arrowheads indicate LAMP1-positive amphisomes and the white arrowhead indicates a LAMP1-negative amphisome. Bar = 500 nm. (F) Graph showing the quantification of the number of LAMP1-positive or -negative lysosomes (Ly) or amphisomes (Am)/endolysosomes (EL) from at least 56 randomly selected areas, from each cell, for each condition in control or MYO1C KD cells growing in complete medium or under starvation conditions. Each data point indicates one cell.

