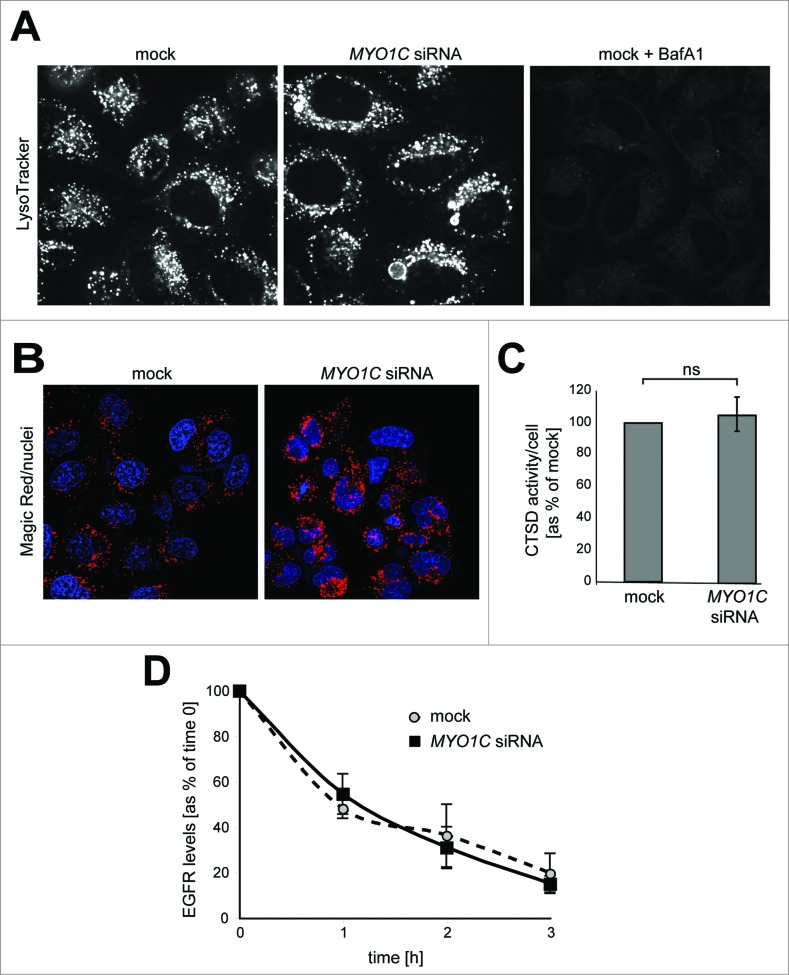
Figure 6.
(See previous page). Analysis of lysosome function in MYO1C-depleted cells. (A) Mock, MYO1C-depleted cells, and bafilomycin A1-treated cells were incubated with the LysoTracker Red probe and imaged using live cell microscopy to monitor lysosomal pH. Swollen lysosomes in MYO1C knockdown cell appear to be acidic. (B) To determine lysosomal enzyme activity in live cells control and MYO1C-depleted HeLa cells were incubated with Magic Red. Confocal microscopy was used to image cathepsin–associated hydrolysis of Magic Red into its red fluorescent form. (C) Calculation of cathepsin activity using Volocity Imaging software revealed no significant difference between cathepsin activity in control and MYO1C-knockdown cells. Values are means ± s.e.m from 3 independent experiments (>1900 cells). ns, not significant. (D) To measure EGFR degradation in control and MYO1C siRNA-treated HeLa cells, cells were serum-starved overnight, and incubated with 100 μg/ml cycloheximide for 2 h before stimulating with 100 ng/ml EGF for 0, 1, 2 and 3 h. EGFR levels were quantified from immunoblots and normalized to a loading control. No significant difference in the rate of EGFR degradation was observed in control and knockdown cells. Values are means ± s.e.m from 3 independent knockdown experiments.

