Figure 1.
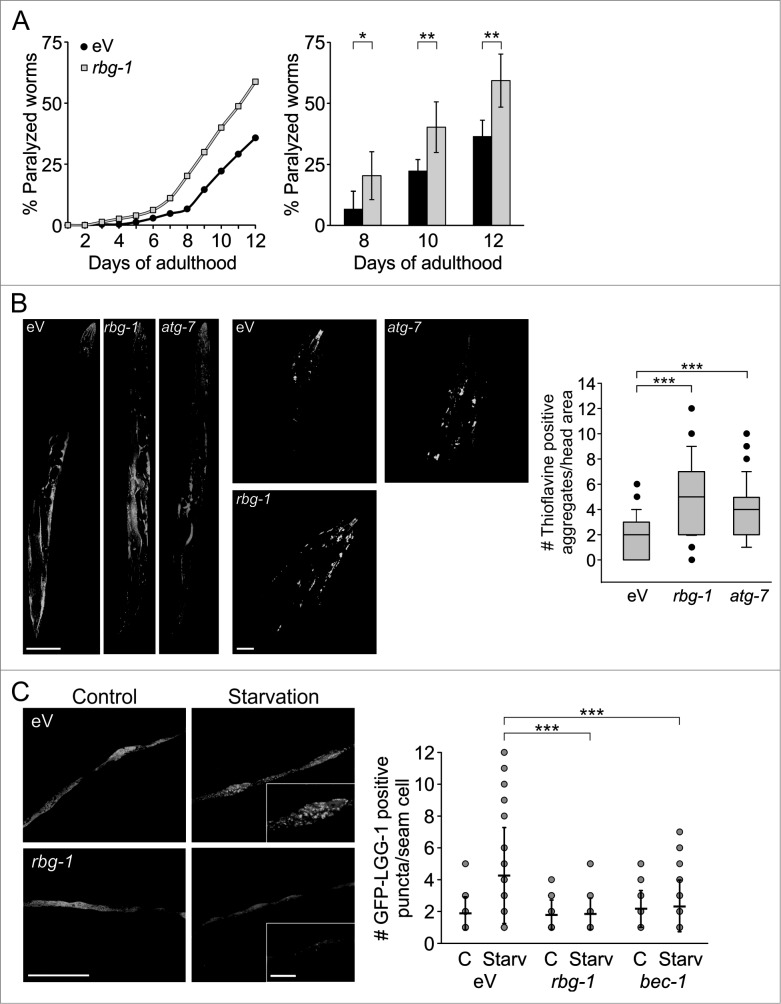
RBG-1 affects proteostasis and autophagy. (A) Paralysis of rbg-1 and eV RNAi-treated CL2006 worms. 316 (eV) and 308 (rbg-1) worms were analyzed. Statistics are depicted as mean ± SD; *P < 0.05, **P < 0.01; n = 6; Oneway Anova. (B) Confocal images of thioflavine stained CL2006 worms and head regions of eV, rbg-1, and atg-7 RNAi-treated worms. Aggregates were counted in 42 (eV), 45 (rbg-1) and 34 (atg-7) head areas. Scale bars = 100 and 20 μm; ***P < 0.001, n = 4, t test. For estimation of background staining, we have employed N2 WT worms and confocal images are depicted in Fig. S2B. (C) Confocal images of seam cells of eV and rbg-1 RNAi-treated GFP-LGG-1 expressing worms and statistical analysis of the total number of autophagosomal structures in at least 20 different cells. Bec-1 RNAi served as control. Scale bars = 50 and 10 μm; statistics are depicted as mean ± SD; ***P < 0.001, n = 3, t test.

