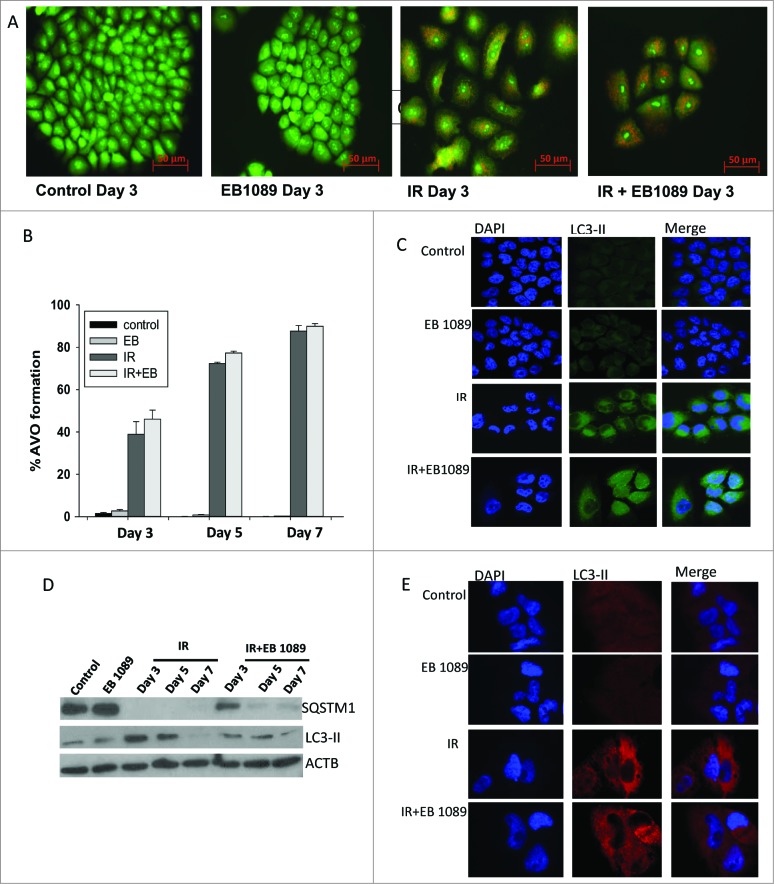
Figure 3.
Autophagy in H460 NSCLC cells. (A) Induction of autophagy in H460 cells by radiation alone or the combination of radiation+ EB 1089. (B) Quantification of acidic vesicle formation in H460 cells by flow cytometry. (n = 3, mean ± SE) (C) GFP-LC3 puncta formation indicative of the induction of autophagy in H460 cells (all images were taken at same magnification). (D) Assessment of autophagic flux markers, SQSTM1 and LC3-II in response to different treatment conditions by protein gel blots. (E) Endogenous LC3-II foci formation was determined by confocal microscopy. Nuclei were stained with DAPI. Images were taken on d 3 at the same magnification.

