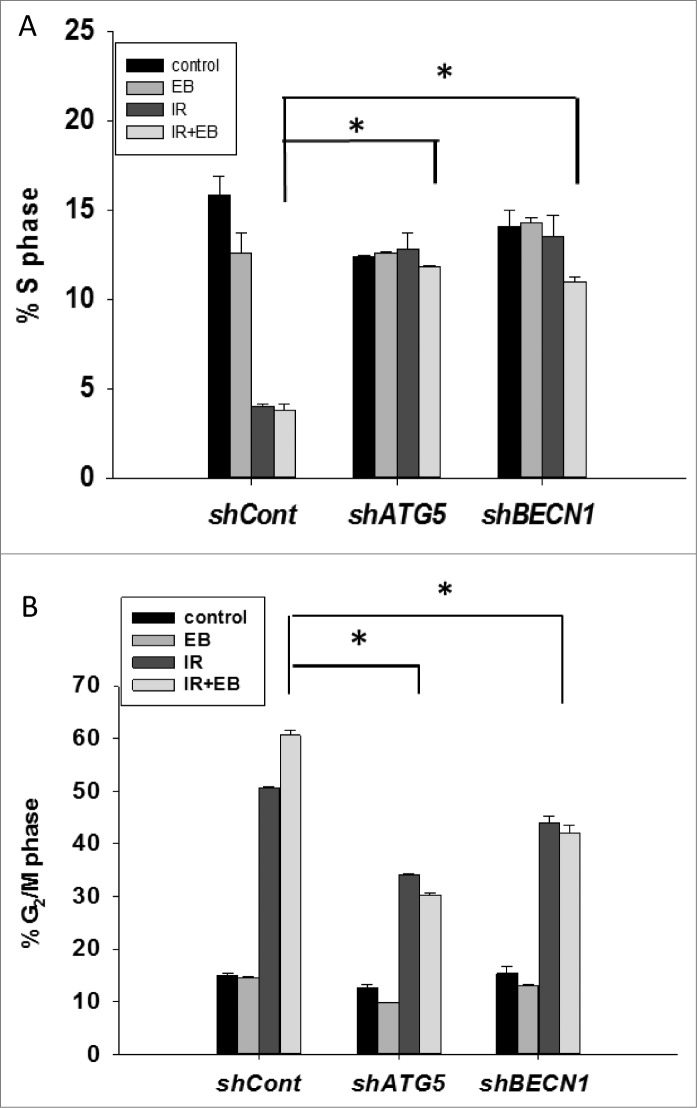
Figure 6.
Cell cycle analysis. Cell cycle analysis was performed in H460 (shcont, shATG5, and shBECN1) cells. (A) Percentage of cells undergoing S-phase is shown (n = 2, mean ± SE, *P < 0.05; shcont IR+EB 1089 compared to shATG5 IR+EB 1089 and shCont IR+EB 1089 is compared to shBECN1 IR+EB 1089). (B) Percentage of cells arresting in G2/M phase is shown. n = 2, mean ± SE, *P < 0.05; shCont IR+EB 1089 compared to shATG5 IR+EB 1089, and shCont IR+EB 1089 is compared to shBECN1 IR+EB 1089.

