Figure 7.
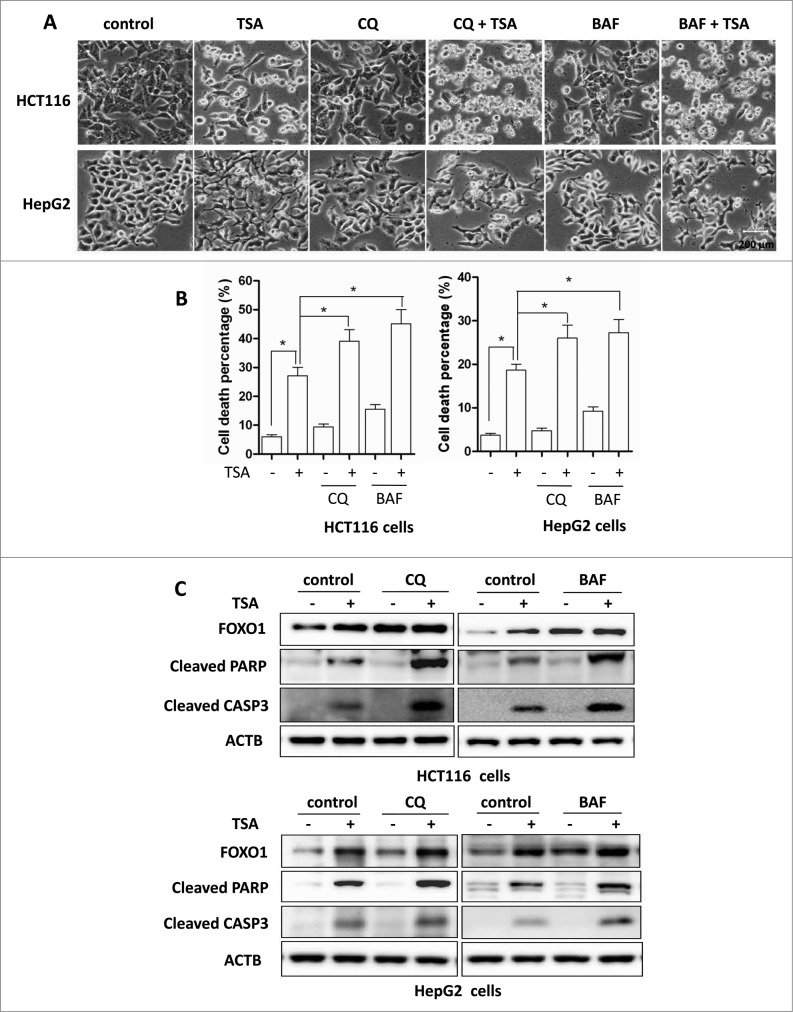
For figure legend, see page 639. Figure 7 (See previous page). Effect of autophagy inhibition on HDACIs-induced cell death. HCT116 cells were treated with TSA (0.5 μM), with or without chloroquine (25 μM) or BAF (25 nM) for 24 h. The concentration of TSA used for HepG2 cells was 1 μM. (A) Morphological changes of HCT116 and HepG2 cells with respective treatments were examined and photographed with an inverted microscope (Scale bar: 200 μm). (B) Cell pellets were subsequently collected and cell death was quantified using propidium iodide (PI) live exclusion staining. Statistical significance (*P < 0.05) is indicated in the bar chart. (C) Cells were then harvested for protein analysis. Cell lysates were resolved in SDS-PAGE and probed with specific antibodies against CASP3 and PARP1.

