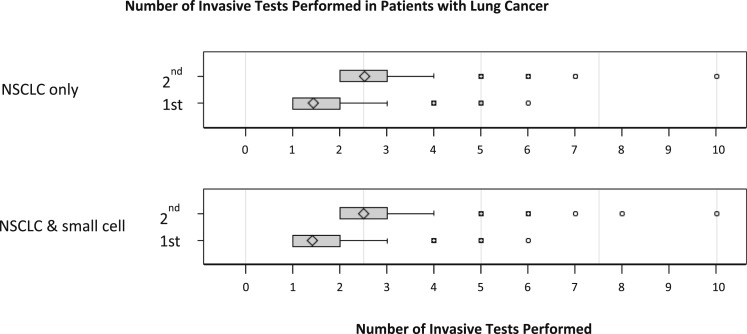
Figure 3.
Number of invasive diagnostic tests performed. Box plots represent median and interquartile range (25th-75th percentile) for the number of invasive tests performed. Patients who had mediastinal sampling as their first test are labeled as first. These patients received guideline-consistent care. Propensity-matched control patients who had mediastinal sampling as a second or later test are labeled as second. Patients who had mediastinal sampling first underwent fewer total tests (P < .0001). The first plot shows the comparison limited to patients with NSCLC given as the final diagnosis. The second plot shows the comparison of patients with NSCLC with patients with small cell lung cancer. See Figure 1 legend for expansion of abbreviation.

