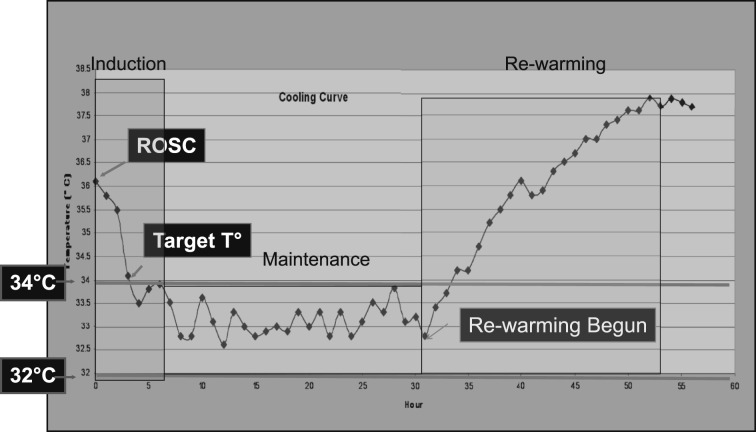
Figure 2.
Phases of targeted temperature management (TTM). An example of a temperature curve for a patient undergoing TTM postcardiac arrest, demonstrating initiation of cooling shortly after ROSC, temperature drop during the induction phase, slight variability around target temperature during the maintenance phase, and gradual increase in temperature during controlled rewarming phase. The patient was a 69-year-old woman who had an out-of-hospital ventricular fibrillation arrest treated with defibrillation and epinephrine with ROSC 16 min after arrest. She was comatose on arrival and a rapid decision was made to initiate therapeutic hypothermia. T = temperature. See Figure 1 legend for expansion of other abbreviation.

