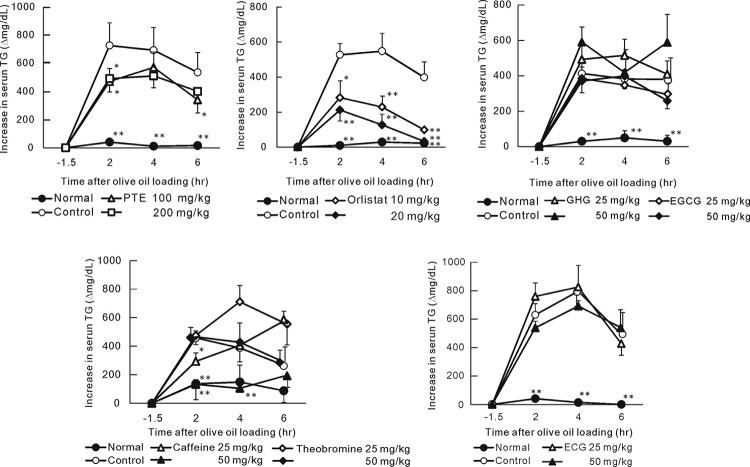
Figure 5.
Effect of PTE and Its Constituents on Serum TG Elevation in Olive Oil-loaded Mice. Each point represents mean with the S.E. (n=6). Asterisks denote significant differences from control at * p<0.05, ** p<0.01, respectively. Fasted mice were orally given PTE or its constituents and olive oil (5 mL/kg) was given 1 hr thereafter. Blood samples were collected 30 min before sample loading and 2, 4 and 6 hr later of olive oil loading.

