Figure 2.
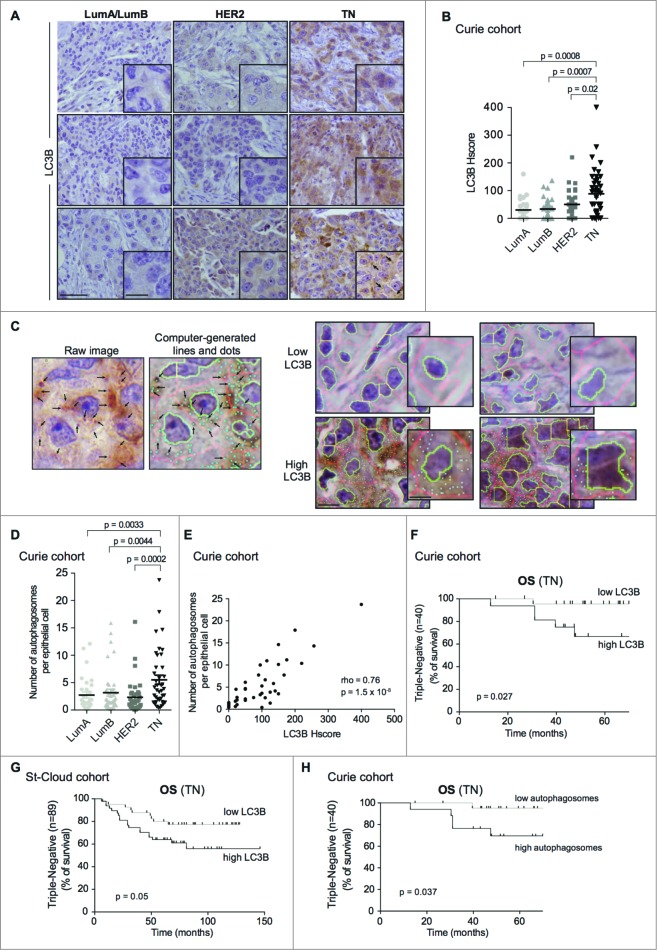
For figure legend, see page 2127. Figure 2 (See previous page). LC3B protein is a marker of poor prognosis in TN BC patients. (A) Representative views of LC3B immunostaining from Luminal A or B (LumA/LumB), HER2 and TN BC subtypes (Curie cohort). Black arrows point to examples of punctate LC3B immunostaining in TN BC sample. Scale bars = 50 μm (low magnification) and 20 μm (high magnification in inserted sections). (B) LC3B histological scoring (Hscore, see the Materials and Methods) among LumA, LumB, HER2 and TN BC subtypes (Curie cohort). (C) Representative views obtained before (raw data) or after treatment of LC3B IHC images with an automated image segmentation and quantification algorithm (Curie cohort, see the Materials and Methods). After computational analysis, autophagic vesicles are shown as blue dots. Nuclear and plasma membranes are in green and red, respectively. Low and high LC3B IHC are shown, as indicated. Scale bars = 20 μm (low magnification) and 10 μm (high magnification in inserted sections). (D) Scatter plot of average number of autophagosomes per epithelial cell in LumA, LumB, HER2 and TN BCs based on the quantification algorithm (Curie cohort). Horizontal bars represent the median values. (E) Correlation between LC3B histological score (Hscore) and the average number of autophagosomes per epithelial cell quantified by the algorithm. Correlation coefficient and p-value are based on Spearman's test. (F) Kaplan-Meier curve of OS for TN BC cases among Curie cohort, with respect to LC3B HScore (N = 24 for low expression and N = 16 for high expression; cut-off value = 100, scatter plot shown in B). (G) Kaplan-Meier curve of OS for TN BC cases among Saint-Cloud cohort with respect to LC3B HScore (N = 41 for low expression and N = 48 for high expression; cut-off value = 40, scatter plot shown in Fig. S4F). (H) Kaplan-Meier curve of OS of TN BC patients from the Curie cohort, with respect to the average number of autophagosomes per epithelial cell (N = 23 for low number and N = 17 for high number; cut-off value = 4.5, scatter plot shown in D). p-values are based on Mann-Whitney test (B,D) or Log-rank test (E,H).

