Figure 5.
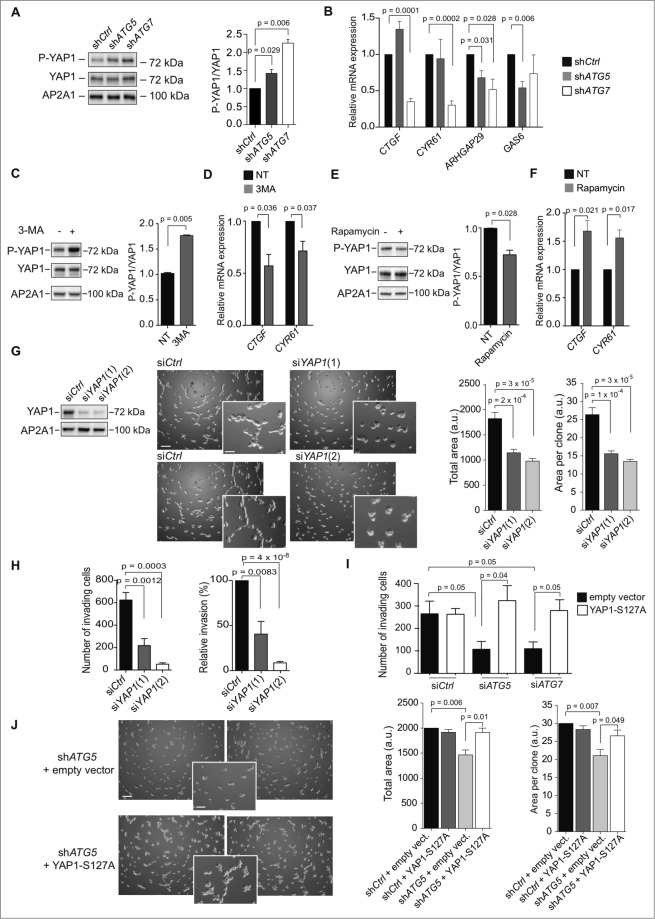
For figure legend, see page 2133. Figure 5 (See previous page). The transcription co-activator YAP1 is a key player in the autophagy-dependent proliferation and invasion of TN BC cells. (A) Western blots showing phosphorylated-YAP1 (P-YAP1), YAP1, and AP2A1 proteins in stable cell lines following 3D culture. AP2A1 is used as internal control for protein loading. The bar graph (right panel) shows the corresponding quantification of P-YAP1/YAP1 protein level ratios. (B) mRNA levels of YAP1-target genes were monitored by RT-qPCR following 3D culture. GAPDH is used as an internal control for total mRNA expression. (C) Western blots (left) and corresponding quantification (bar graph, right) showing phosphorylated-YAP1 (P-YAP1), YAP1 and AP2A1 proteins in MDA231 cells cultured during 3 d in 3D and then either untreated (-) or treated with 3-methyladenine (3-MA; 20 mM) for 3 h. (D) mRNA levels of YAP1-target genes were monitored by RT-qPCR following 3-MA treatment. GAPDH is used as an internal control for total mRNA expression. (E) Western blots (left) and corresponding quantification (bar graph, right) showing phosphorylated-YAP1 (P-YAP1), YAP1 and AP2A1 proteins in MDA231 cells cultured during 3 d in 3D and then either untreated (-) or treated with rapamycin (2 μM) for 3 h. (F) mRNA levels of YAP1-target genes were monitored by RT-qPCR following rapamycin treatment. GAPDH is used as an internal control for total mRNA expression. (G) Left, western blots showing YAP1 protein levels in MDA231 cells after transfection with control- (siCtrl) or YAP1-targeted (siYAP1) siRNA. AP2A1 is used as an internal control for protein loading. Middle, representative bright field images from Control- or YAP1-depleted cells cultured in 3D, as indicated. Scale bars = 100 μm (low magnification) and 50 μm (high magnification). Right, the bar graphs represent the total area covered by the stellate structures per field (left panel) and the area per clone (right panel). Data are shown as means +/− sem (N = 3 independent experiments). p-values are based on the Student t test. (H) Invasion assay using a BioCoatTM MatrigelTM Invasion Chamber from MDA231 cells transiently transfected with control- (siCtrl) or YAP1-targeted (siYAP1) siRNA. for 72 h prior to the assay. Left histogram: Numbers of invading cells, which passed through a Transwell over 6 h of incubation. Right panel: Percentage of cells, relative to siCtrl (100%), which passed through a Transwell over 6 h of incubation. Data are shown as means +/− sem (N = 3 independent experiments). p-values are based on the Student t test. (I) Invasion assay using a BioCoatTM MatrigelTM Invasion Chamber from autophagy-deficient MDA231 cells (36 h of transfection with siATG7 or siATG5, as indicated), transfected again (36 h) with an empty vector or a vector expressing YAP1-S127A, a nonphosphorylable mutant form of YAP1. Numbers of invading cells, which passed through a Transwell over 6 h of incubation, are shown. Data are shown as means +/− sem (N = 3 independent experiments). p-values are based on the Student t test. (J) Results are from autophagy-proficient (shCtrl) or autophagy-deficient (shATG5) MDA231 cells, transfected with an empty vector or a vector expressing YAP1-S127A, after 3 d of 3D culture. Representative bright field images from ATG5-depleted cells expressing or not YAP1-S127A, as indicated. Scale bars = 100 μm (low magnification) and 50 μm (high magnification). Bar graphs represent the total area covered by the stellate structures per field (left panel) and the area per clone (right panel). Data are shown as means +/− sem (N = 5 independent experiments). P-values are based on the Student t test.

