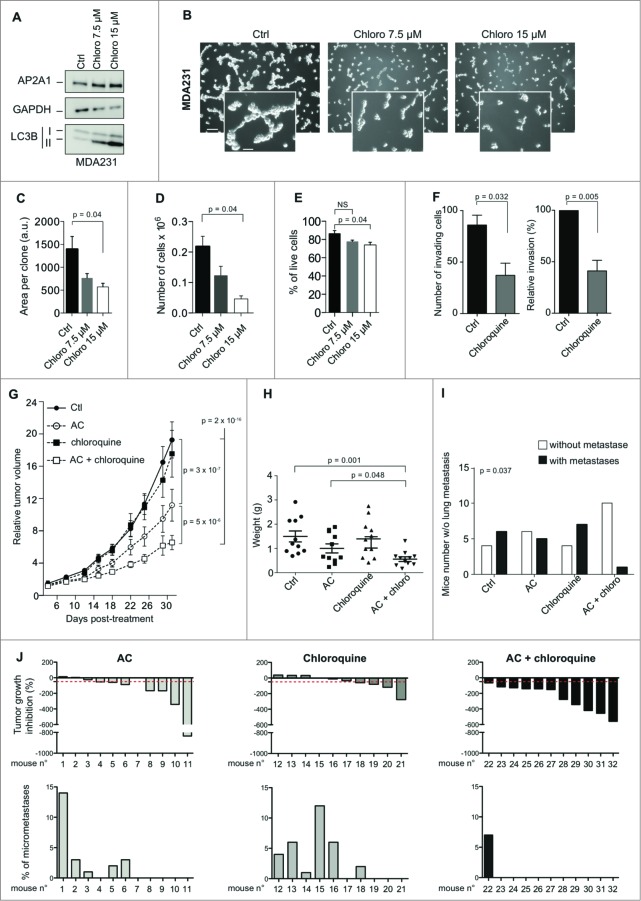
Figure 7.
For figure legend, see page 2136. Figure 7 (See previous page). Chloroquine potentiates chemotherapy in a PDX model of high-LC3B TN BC. (A) Western blots showing LC3B-I/-II protein levels in MDA231 TN BC cell line untreated (Ctrl) or treated for 3 d with 2 doses of chloroquine (Chloro; 7.5 or 15 μM), as indicated. AP2A1 and GAPDH are used as internal controls for protein loading. (B) Representative bright field images of MDA231 TN BC cells cultured in 3D conditions. Cells are either treated with PBS (Ctrl) or treated with 2 doses of chloroquine, as indicated. Scale bars = 100 μm, (low magnification) and 50 μm (high magnification). (C) The bar graph represents the total area per clone upon chloroquine treatment, as determined using Metamorph software. Data are shown as means +/− sem (N = 3 independent experiments). p-values are based on the Student t test. (D,E) Bar graphs show the total number of cells (D) and the percentage of live cells, as assessed by trypan blue-negative cells, (E) after 3 d of 3D culture. Results are from MDA231 cells either treated with PBS (Ctrl) or treated with 2 doses of chloroquine, as indicated. Data are shown as means +/− sem (N = 3 independent experiments). p-values are based on Student t test. (F) Invasion assay using a BioCoatTM MatrigelTM Invasion Chamber from MDA231 cells, either untreated (Ctl) or treated with (50 μM) of chloroquine overnight. Left histogram: Numbers of invading cells, which passed through a Transwell over 6 h of incubation. Right panel: Percentage of cells, relative to siCtrl (100%), which passed through a Transwell over 6 h of incubation. (G) Tumor growth curves over time of a high-LC3B PDX model. When tumors reached 50 mm3, mice were treated either with PBS (Ctrl), AC (adriamycin and cyclophosphamide), chloroquine, or a combination of AC and chloroquine, for 31 d. Relative tumor volumes are presented as means ± sem (N ≥ 10 mice per group). p-values are based on 2-way ANOVA test. (H) Graph shows the final weight of each tumor in each group (n ≥ 10 per group). p-values are based on the Student t test. (I) The bar graph shows the number of mice without (white) or with (black) lung metastases, as assessed by the detection of human-specific Alu sequences in RNA extracted from mouse lung. N ≥ 10 animals per condition. p-value is based on Fisher's exact test. (J) Upper Panel, tumor growth inhibition (defined as % of tumor volume before treatment) is shown for each mouse following AC treatment, administration of chloroquine alone or a combination of AC + chloroquine, as indicated. Lower Panel, quantification in each mouse of lung colonization by tumor cells. Lung colonization was quantified by the detection of human-specific Alu sequences. Lung metastases are quantified after 31 d of treatment with AC, chloroquine or AC + chloroquine, as indicated. N ≥ 10 tumors for each condition. Numbers below each graph represents the tag number of each mouse.

