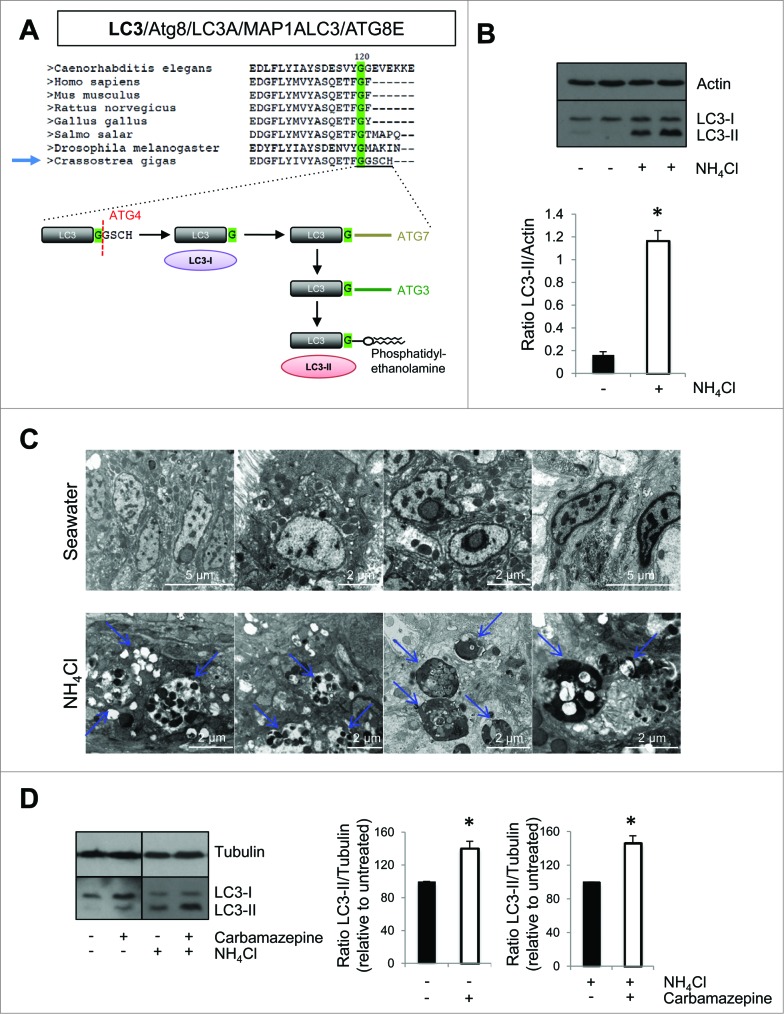
Figure 2.
Autophagy flux in Pacific oyster. (A) Sequence alignement and glycine conservation in position 120; cleavage model of Atg8 and association with a phosphatidylethanolamine. (B) LC3 western blot after contact with NH4Cl, during 20 h. (C) Transmission electron microscopy examination of oyster mantle 20 h post NH4Cl treatment or seawater (control condition). (D) LC3 western blot after contact during 20 h with carbamazepine and NH4Cl+carbamazepine to show autophagy flux in Pacific oysters.

