Figure 8.
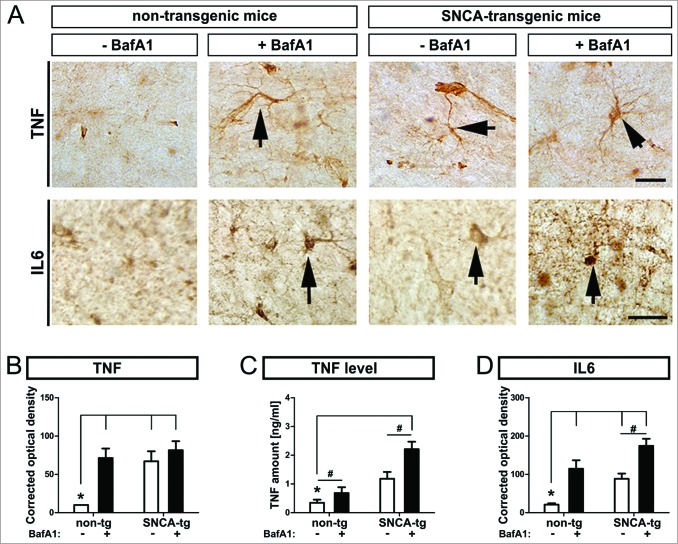
Inflammatory response in transgenic mice, by BafA1 treatment. Immunohistochemical assessment of the inflammatory response in SNCA transgenic mice. (A) Representative images of the inflammatory marker TNF and IL6 in the hippocampus of SNCA-tg and non-tg mice treated with BafA1 or vehicle. Black arrows indicate TNF and IL6 immunoreactivity. Scale bar for TNF and IL6 in the hippocampus 30 μm. Optical density quantification of (B) the inflammatory markers TNF and (D) IL6 in the hippocampus of SNCA-tg mice compared to non-tg mice. (B) to (D) Effects of BafA1 treatment in the hippocampus of SNCA-tg mice compared to vehicle treatment. (C) The absolute amount of TNF as measured by ELISA in SNCA-tg mice treated with BafA1 compared to vehicle-treated animals. All values are mean + s.e.m; differences are significant at (#) P < 0.05, unpaired t test and at (*) P < 0.01.

