Figure 2.
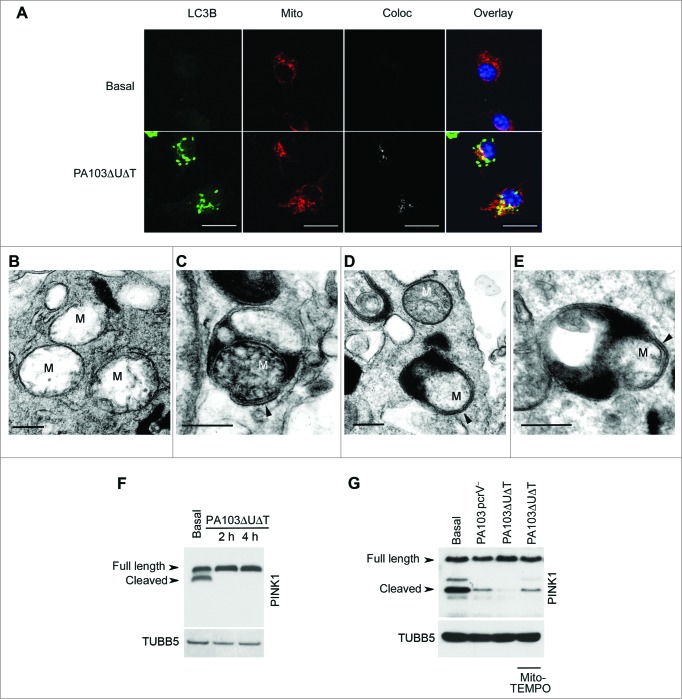
Infected BMDMs undergo mitophagy. (A) Representative confocal images of BMDMs infected with PA103ΔUΔT (MOI 25 for 4 h) and stained for LC3B (green), and mitochondrial ATPIF1 (Mito, red); nuclei are stained blue with DAPI. Coloc shows areas of colocalization of the mitochondrial and LC3B staining in gray. Overlay shows the merged LC3B and mitochondrial signals; colocalizing areas shown as yellow. Scale bar = 5 μm. Repeated 3 times. ((B)to E) Electron micrographs of autophagosomes of untreated BMDM (B) or infected with PA103ΔUΔT(MOI 25) for 4 h (C) to (E). Arrowhead indicates autophagosome with enclosing double membrane, M indicate mitochondria. Scale bar is 500 nm. Representative image from > 10 infected cells. (F) Immunoblot of BMDMs infected at a MOI of 25 with PA103ΔUΔT for the indicated times probed for PINK1. Full-length and cleaved PINK1 are labeled. The blot was reprobed for TUBB5 as a loading control. (G) As (F) but with infections and treatments as shown and is representative of 2 independent experiments.

