Figure 1.
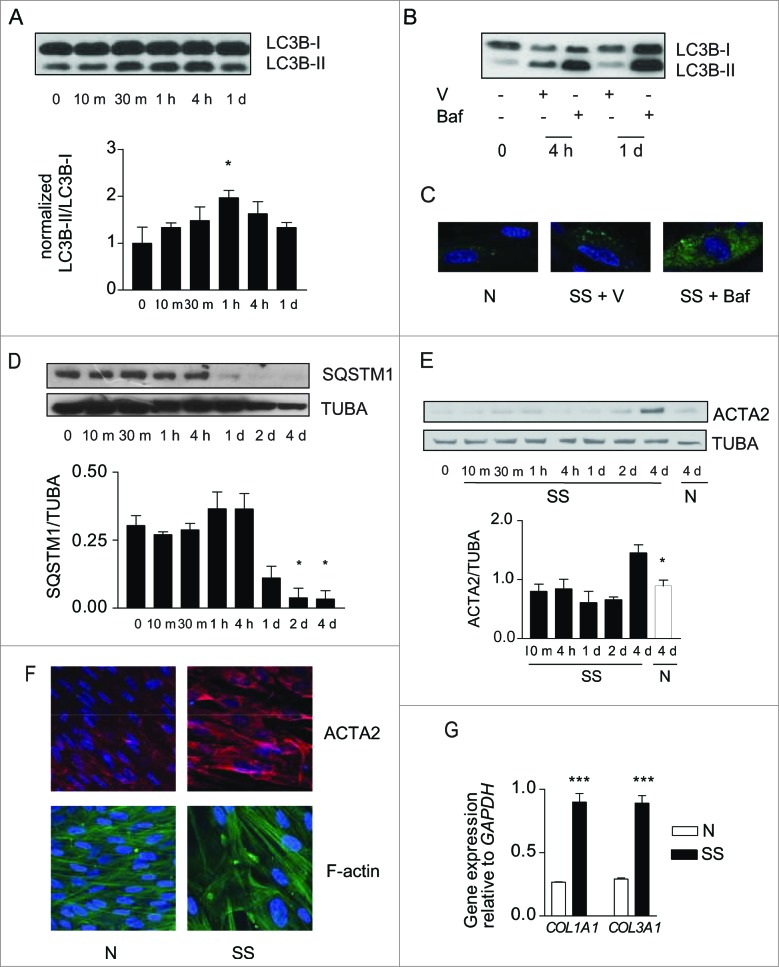
(See previous page). Starvation induces autophagy and myofibroblast differentiation. (A) Upper panel: Western blot showing LC3B-I and -II protein levels in WI-38 fibroblasts exposed to serum-free (starvation) medium (SS). Lower panel: Densitometric analysis of LC3B-II relative to LC3B-I normalized to time 0 (representative of 4 independent experiments, *P < 0.05 t = 0 vs 1 h). (B) Western blot showing LC3B-I and -II protein levels in WI-38 fibroblasts at baseline, starved for 4 h or 1 d and exposed to DMSO (V) or bafilomycin A1 (20 nM; Baf). Representative of 3 independent experiments. (C) Evaluation of LC3B puncta by confocal microscopy in WI-38 fibroblasts infected with a baculovirus vector expressing GFP-LC3B and exposed to normal conditions (medium with 10% FBS; N), serum-free medium with DMSO (V) or serum-free medium with bafilomycin A1 (20 nM) for 1 d. Representative of 3 independent experiments. (D) Upper panel: Western blot showing SQSTM1 and tubulin (TUBA) protein levels in starved WI-38 fibroblasts. Lower panel: Densitometric analysis of SQSTM1 protein levels relative to tubulin. Data are presented as mean ± s.e.m. (representative of 4 independent experiments, *p = 0.02 4 h vs 2 d and 4 h vs 4 d). (E) Upper panel: Western blot showing ACTA2 protein levels in WI-38 fibroblasts exposed to SS medium or grown under normal conditions (N). Tubulin was used as a loading control. Lower panel: Densitometric analysis of ACTA2 protein levels relative to tubulin normalized to time 0 (representative of 4 independent experiments; *p = 0.0170 SS vs N at 4 d). (F) Evaluation of the myofibroblast markers ACTA2 (red) and stress fiber (green) by immunofluorescence microscopy in cells grown in normal medium (N) or maintained without serum (SS) for 4 d. Representative of 3 independent experiments. (G) Real-time qPCR evaluation of mRNA levels of COL1A1 and COL3A1 after 4 d in N or SS. GAPDH was used as the reference gene (***P < 0.001 N vs SS, representative of 2 independent experiments performed in triplicate).

