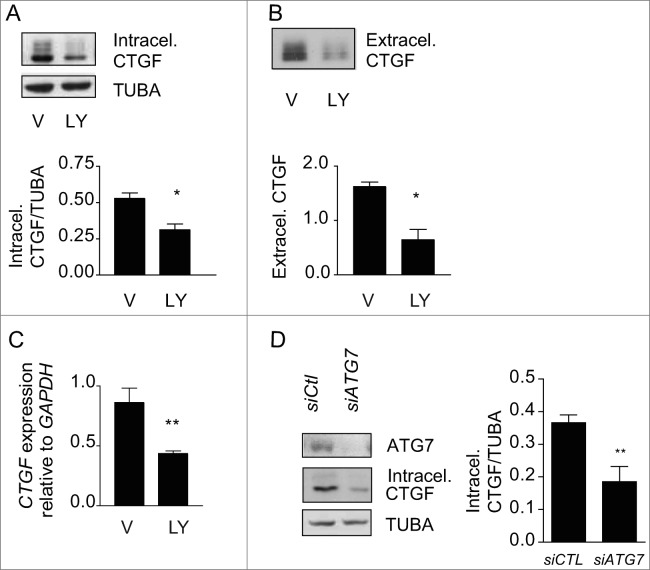
Figure 4.
Autophagy is central for CTGF upregulation in starved fibroblasts. (A) Upper panel: Western blot showing intracellular CTGF protein levels in serum-starved WI-38 fibroblasts incubated with the autophagy inhibitor LY294002 5 uM (LY) or vehicle (V) for 4 d. Representative of 4 independent experiments. Lower panel: Densitometric analysis of intracellular CTGF protein levels relative to tubulin (representative of 4 independent experiments, *p = 0.0286). (B) Upper panel: Western blot of extracellular CTGF protein levels in media conditioned by starved WI-38 fibroblasts in the presence of the inhibitor LY294002 5 uM (LY) or vehicle (V) for 4 d. Representative of 4 independent experiments. Lower panel: Densitometric analysis of extracellular CTGF protein levels (representative of 4 independent experiments, *p = 0.03 V vs LY at 4 d). (C) Evaluation of CTGF expression by qPCR in WI-38 fibroblasts exposed to serum-free medium (SS) in the presence of LY294002 5 uM (LY) or vehicle (V) for 4 d (**p = 0.0036). CTGF expression was normalized to GAPDH. CTGF mRNA levels of fibroblasts grown in normal medium or starved for 4 d from the same experiment are shown in Figure 3C. Representative of 2 independent experiments performed in triplicate. (D) Left panel: Western blot showing ATG7, CTGF and tubulin (TUBA) protein levels in WI-38 fibroblasts exposed to SS for 4 d post-nucleofection with control siRNA (siCTL) or siRNA specific to ATG7 (siATG7). Representative of 4 independent experiments. Right panel: Densitometric analysis of CTGF level relative to tubulin (**p = 0.0087 representative of 4 independent experiments) in WI-38 fibroblasts silenced for ATG7 expression (ATG7 silencing is effective at 87.4% ± 4.4%, representative of 4 independent experiments, *** P < 0.0001).

