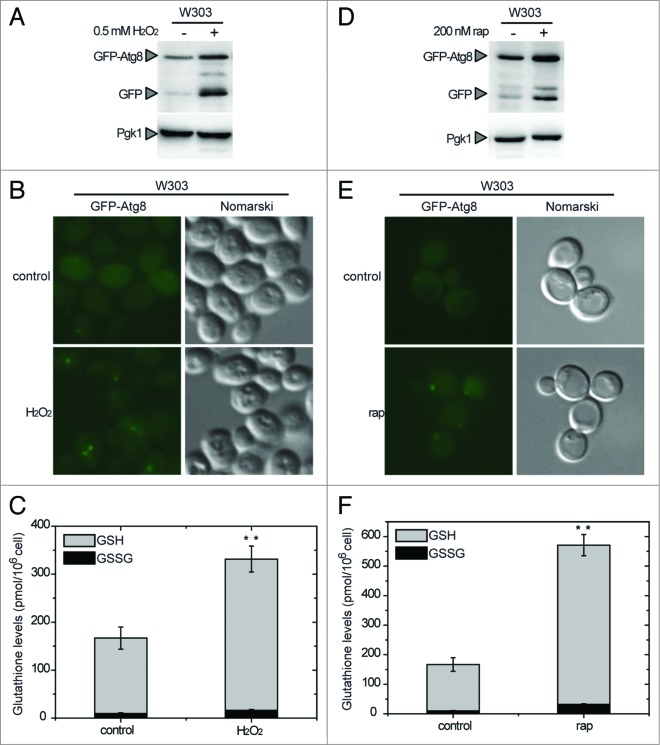
Figure 1.
Connection between autophagy and the intracellular redox state in Saccharomyces. Analysis by western-blot of GFP-Atg8 cleavage assay in wild-type (WT) yeast cells growing exponentially in SD and treated with 0.5 mM H2O2 for 4 h (A) or 200 nM rapamycin for 2 h (D). Thirty micrograms of total extracts from untreated or treated cells were resolved by 12% SDS-PAGE followed by western blotting with anti-GFP and anti-Pgk1. The GFP-Atg8 fusion or free GFP proteins are marked with arrowheads. (B and E) Cells described in (A and D), respectively, were collected and processed for fluorescence microscopy analysis. The signal corresponds to GFP-Atg8. (C and F) Total gluthatione levels were measured in cells treated as described in (A and D), respectively. The data are represented as mean ± standard deviation from 5 independent experiments. “**,” Differences were significant at P < 0.01 according to the Student t test between untreated (control) and H2O2-treated cells (C), and between untreated (control) and rapamycin-treated cells (F).

