
Figure 5.
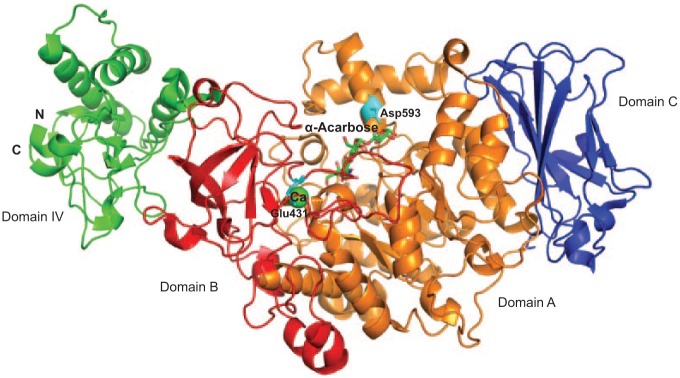
Structure of the catalytic domain of GtfC from Streptococcus mutans. Domain A is colored in orange, domain B is colored in red, domain C is colored in blue, and domain IV is colored in green. Residues Glu431 and Asp593 are colored in cyan. α-Acarbose is shown as a stick. Ca is shown as a sphere and colored in green (PDB entry, 3AIC).