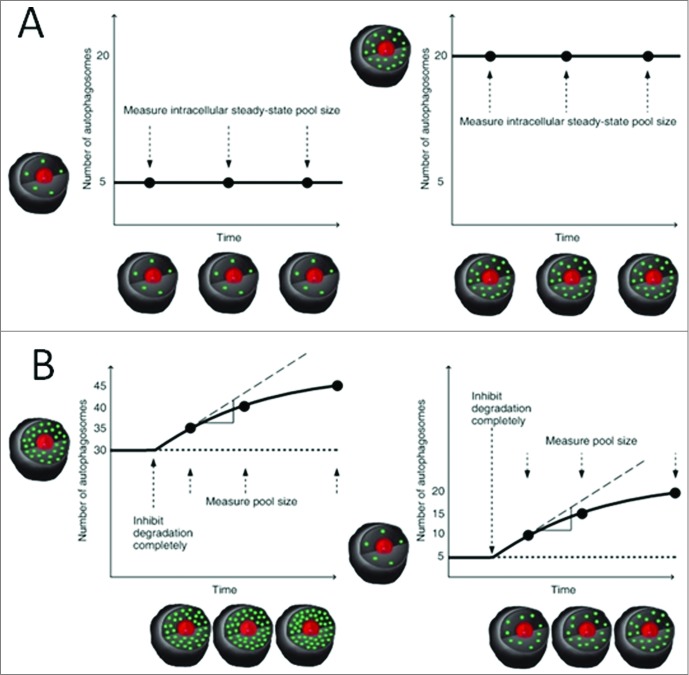
Figure 3.
Generation of progress curves I. (A) Counting of autophagosomes (nA) over time under control conditions is required to show whether the system is at steady state. (B) The quantitative measurement of the basal autophagosome flux, J, at steady state expressed as autophagosomes produced/cell/time. Here the autophagosome pool size differs (nA = 30, left and nA = 5, right), while the basal flux J = 5 is equal in both systems.

