Figure 3.
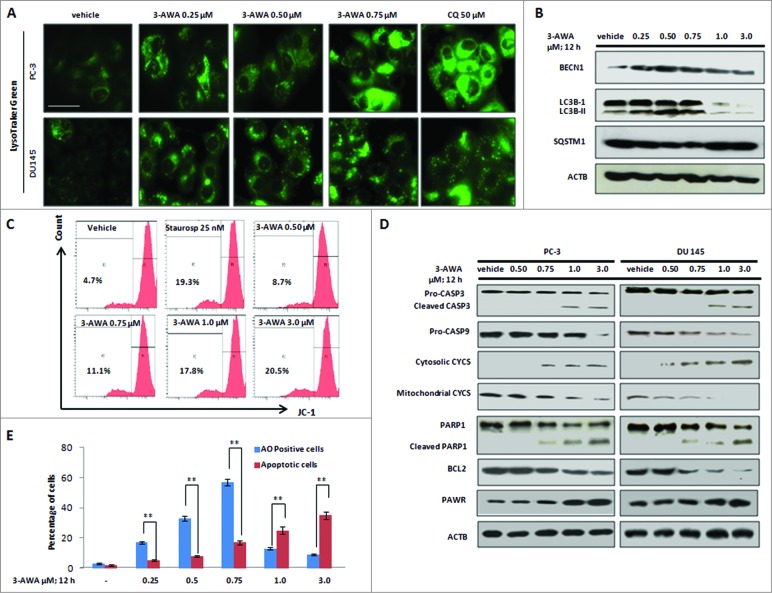
Switching from autophagy to apoptosis is mediated by low vs. high concentrations of 3-AWA. (A) CaP cells were treated with the indicated concentrations of 3-AWA along with CQ as positive control for 12 h. The cells were then stained with LysoTracker Green. Fluorescent images were obtained from the Floid cell imaging station with 20x (scale bar = 100 μm). (B) Whole cell lysates from PC-3 cells treated with the indicated concentrations of 3-AWA was subjected to western blot analysis with BECN1 (upper panel), LC3B-I/II (middle panel), SQSTM1 (lower middle) and ACTB (lower panel) as a loading control. (C) After treatment with the indicated concentrations of 3-AWA, the positive control staurosporine and vehicle DMSO, PC-3 cells were stained with JC-1 dye, as described in material and methods to measure mitochondrial membrane potential using FACS analyzer. (D) Whole cell lysates of PC-3 and DU 145 cells treated with different concentrations of 3-AWA/vehicle was subjected to western blot analysis to determine the level of CASP3, CASP9, PARP1 cleavage, cytosolic and mitochondrial CYCS, antiapototic BCL2, proapoptotic PAWR and the loading control ACTB chronologically from top to bottom (E) Graphical representation of quantification of percentage of autophagic cells (AO positive) and apoptotic cells (DAPI positive) upon low to high concentration of 3-AWA treatment in CaP cells. Autophagic and apoptotic cell scoring was performed randomly (100 cells/field) and data represents 3 individual experiments ± SE, **P < 0.01.

