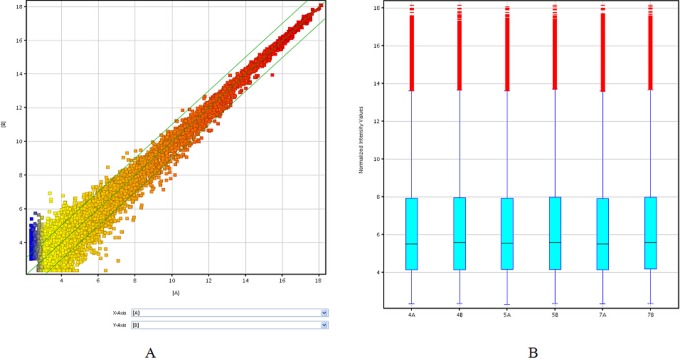
Figure 1.
The expression profiles of lncRNAs compared between P-CCs and paired H-CCs. The scatterplot (A) is a visualization method used for assessing the lncRNA expression variation between P-CCs and paired H-CCs. The values of X and Y axes in the scatterplot are the normalized signal values of the group (log2 scaled). The green lines are fold change lines (the default fold change value given is 2.0). The box plot (B) is a convenient way to quickly visualize the distributions of a data set for the lncRNAs profiles. It is commonly used to compare the distributions of the intensities from all samples. After normalization, the distributions of log2 ratios among 3 pairs tested samples are nearly the same. H-CC indicates high-quality embryo; lncRNA, long noncoding RNA; P-CC, poor-quality embryo. (The color version of this figure is available in the online version at http://rs.sagepub.com/.)

