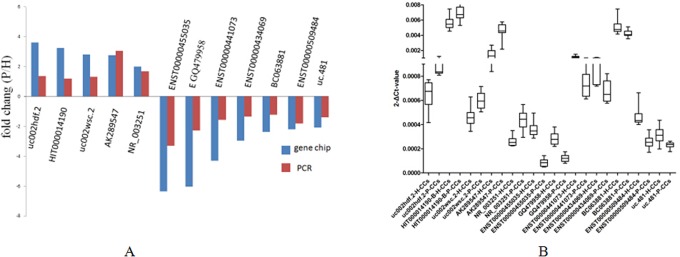
Figure 3.

The differential expression of lncRNAs validated by qRT-PCR. A, Comparison between microarray and qRT-PCR results. Twelve differentially expressed lncRNAs were validated by qRT-PCR. The Y-axis represents the fold changes (P/H) in expression across the 3 samples (P value <.05). The qRT-PCR results and microarray data are consistent. B, Distributions of the lncRNA expression levels (P value <.05). Twelve differentially expressed lncRNAs were validated by qRT-PCR in 11 pairs of high-quality embryo (H-CC) and grade poor-quality embryo (P-CC). lncRNA indicates long noncoding RNA; qRT-PCR, quantitative real-time polymerase chain reaction; P/H, P-CCs/H-CCs.
