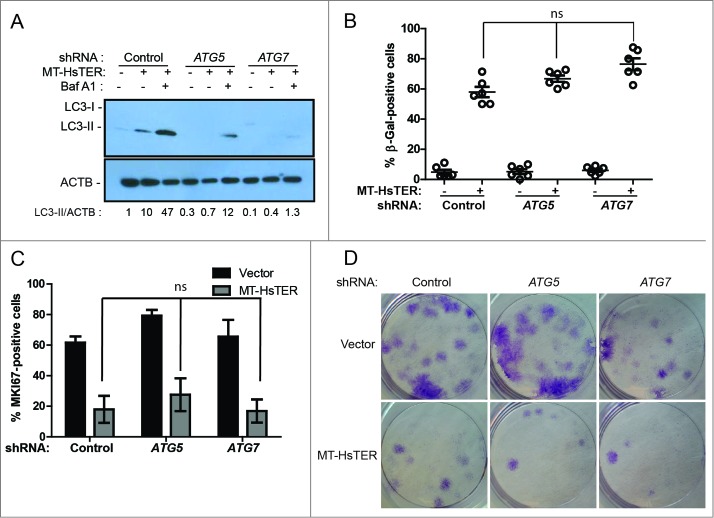
Figure 3.
Autophagy inhibition does not affect the senescence transition following MT-HsTER treatment of WI-38 fibroblasts. (A) LC3B immunoblotting in WI-38-TERT fibroblasts transduced with a control, ATG5, or ATG7 shRNA and treated with 25 nM BafA1, 7 d after MT-HsTER addition. Relative amounts of LC3-II are indicated below the blots. (B) SA-β-gal staining 7 d after MT-HsTER addition. SA-β-gal staining showed a significant increase between vector and MT-HsTER cells (P < 0.05) but no significant differences were observed between the MT-HsTER-treated samples. Error bars represent standard error. (C) MKI67 staining in WI-38-TERT fibroblasts expressing a control, ATG5, or ATG7 shRNA, 7 d after MT-HsTER transduction. MT-HsTER-treated samples showed a significant depletion of MKI67-positive cells compared to controls (P < 0.05). Error bars represent standard deviation. (D) Crystal violet-stained colonies showing colony forming efficiency upon platting 3 × 10³ cells 8 d after MT-HsTER addition. Results are representative of at least 3 independent experiments.

