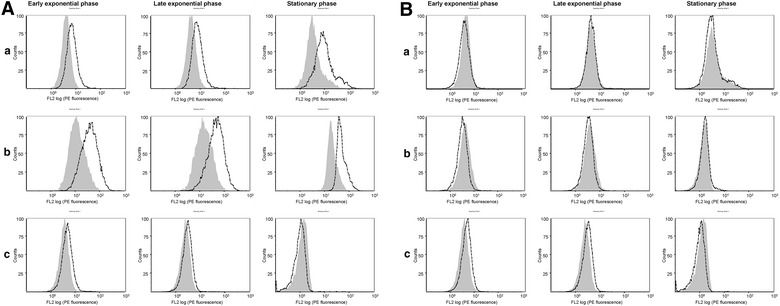
Figure 9.

Cytometry analysis of WT HtrA protein exposure at the staphylococcal cell surface. The cell surface exposure of WT HtrA1 (A) and HtrA2 (B) proteins from strain Lowenstein was analyzed by flow cytometry. Staphylococcal cells were grown either in TSB medium (a), TSB supplemented with 2,2′ Dipyridyl 1 mM (b), or SATA-2 medium (c) till early exponential phase, late exponential phase or late stationary phase. Shaded and white areas represent cells incubated with antibodies against SP02 adjuvant or each rHtrA protein (rHtrA1 in A and rHtrA2 in B) respectively.
