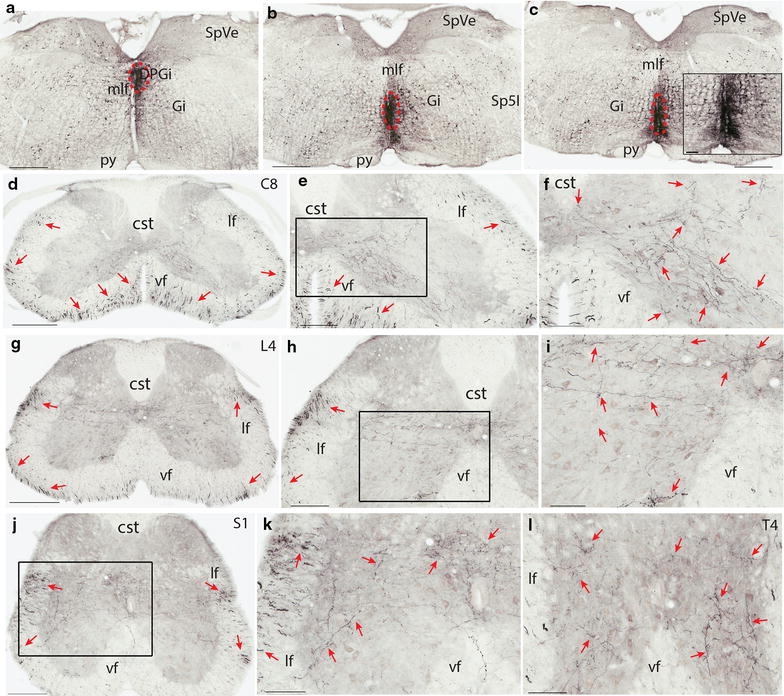
Figure 1.

Termination pattern of BDA labeled fibers arising from RPa and ROb. a–c An injection site in RPa and ROb, which involved the dorsal paragigantocellular reticular nucleus (red dashed circle). d A C8 section showing the labelled fibers in both the ventral and lateral funiculi (red arrows). e A C8 section showing labeled fibers in both the ventral and lateral funiculi (red arrows) and the medial lamina 7, and 8, and lamina 10. f A higher magnification of the rectangular area in e. Note labeled fibers in medial laminae 7, 8, and 9, and 10. g An L4 section showing labeled fibers in both the ventral and lateral funiculi (red arrows). Note there are more fibers in the lateral funiculus than in the ventral funiculus. h An L4 section showing labeled fibers in the lateral funiculus and in laminae 6–10. i A higher magnification of the rectangular area in h. j An S1 section showing labeled fibers in the lateral and ventral funiculi and in laminae 6–10. Note there are more fibers in the lateral funiculus than in the ventral funiculus. k A higher magnification of the rectangular area in j. l A T4 section showing labeled fibers in laminae 7–10 (red arrows). The scale bar 500 μm in a–c, 400 μm in d and g, 200 μm in e, h, and j, 100 μm in f, i, k, l and the microphotograph in c.
