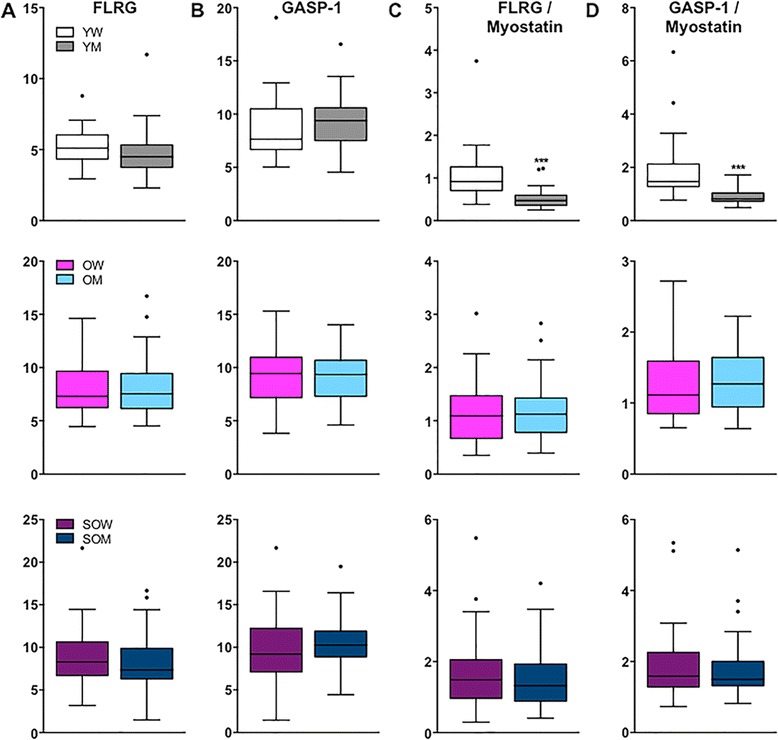
Fig. 5.

Circulating FLRG and GASP-1 concentrations in women compared to men. Box plots (25–75 percentile) and whiskers (Tukey method) showing comparisons of a FLRG, b GASP-1, c FLRG relative to myostatin, and d GASP-1 relative to myostatin between younger women (YW) and younger men (YM) (top panel), older women (OW) and older men (OM) (middle panel), and sarcopenic OW (SOW) and sarcopenic OM (SOM) (bottom panel). *** denotes p < 0.001
