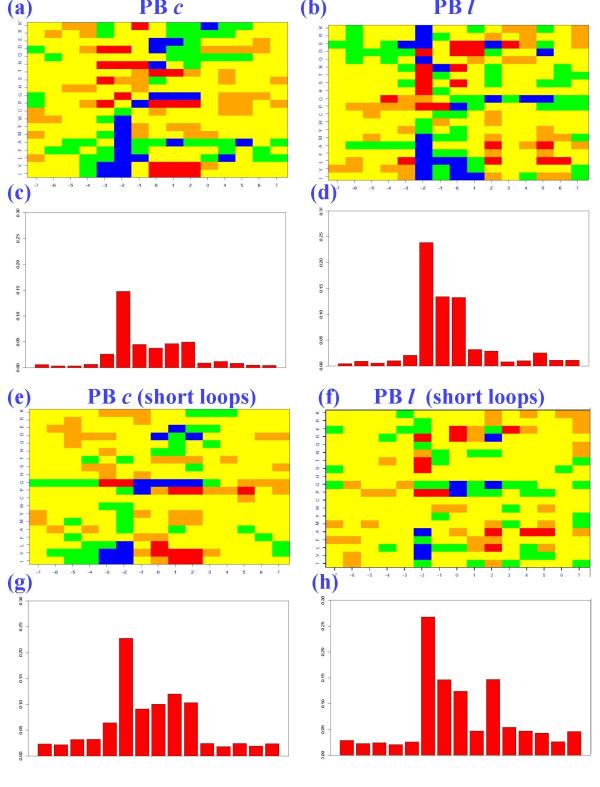
Figure 4.

Analysis of PBs c and l in short loops. The left part corresponds to PB c and the right to PB l. (a), (b), (e) and (f) are the amino acid Z-scores, with (blue): Z-score < (-4.4), (green): (-4.4) < Z-score < (-1.96), (yellow): (-1.96) < Z-score < 1.96, (orange): 1.96 < Z-score < 4.4 and (red): Z-score > 4.4. For prediction purpose, a five-residue PB (numbered from -2 to +2) is encompassed in a longer fragment of 15 amino acids in length (numbered from -7 to +7). (c), (d), (g) and (h) are the asymmetric Kullback-Leibler distributions. (a) and (c) correspond to PB c, (b) and (d) to PB l in the complete databank. (e) and (g) correspond to PB c and (f) and (h) to PB l in the short loops.
