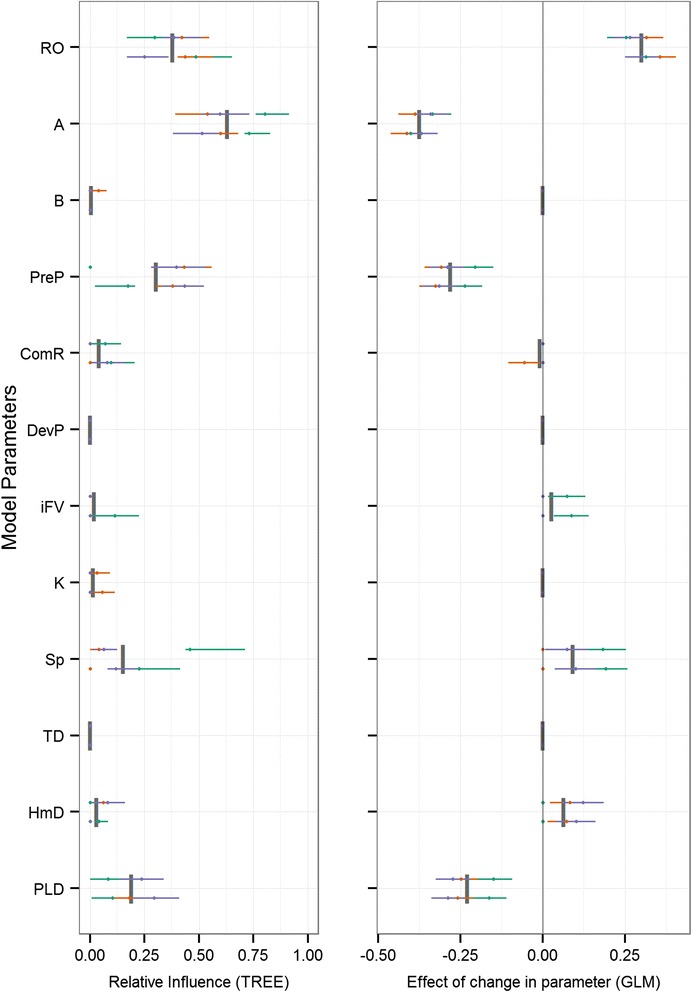
Fig. 6.

Model sensitivity for metapopulation growth rate (λM). Two-panel plot of the influence of model parameters (y-axis) on metapopulation growth rate. The regression tree GSA relative influence (left) and generalized linear regression beta coefficients (right) are plotted for all reefs (individual horizontal bars spread vertically in each parameter’s row) and release times (unique colours within each reef’s horizontal bar). Parameter means are shown as grey vertical bars
