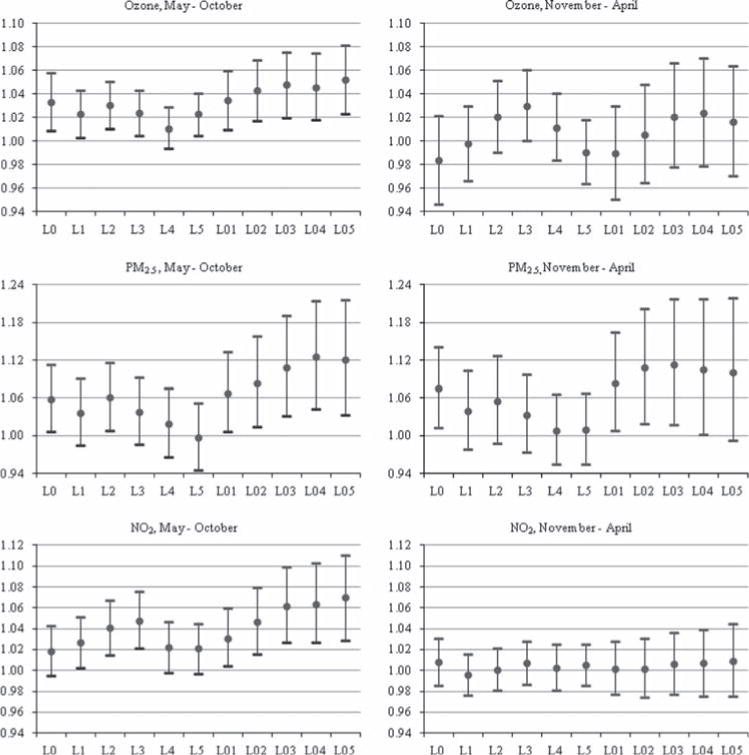
Fig. 3.

Adjusted odds ratios and 95% confidence intervals for each pollutant at various lags and cumulative averages, by season. Odds ratios indicate the likelihood of initial asthma diagnosis associated with 10 ppb increases in short-term O3 and NO2, and 10 μg/m3 increase in short-term PM2.5. Study population includes Harris County, Texas children enrolled in Medicaid between 2005 and 2007. All models are adjusted for same-day maximum temperature, mean relative humidity and mold spore, tree pollen, grass pollen and weed pollen counts. L0 through L5 indicate single same-day through lag 5-day pollutant values, and L01 through L05 indicate 2-day through 6-day cumulative mean pollutant values.
