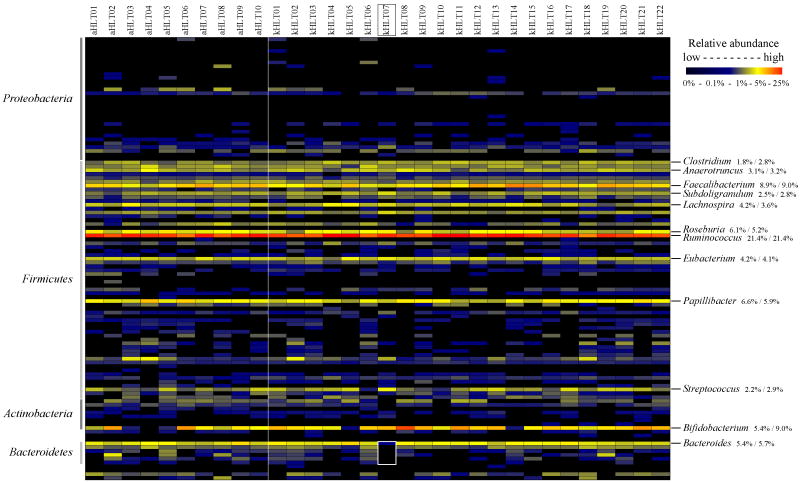
Figure 3. Distribution of genus relative abundances among samples.
Different experiments are plotted as columns; 115 analysed genera are plotted as rows. Relative abundances of each genus are plotted using a gradient scale as shown in the legend. aHLT – healthy adult samples; kHLT – healthy adolescent samples. Vertical line separates aHLT and kHLT samples. The 12 most abundant genera are shown on the right side; numbers represent relative average abundance of each genus (weighted mean) in aHLT and kHLT samples, respectively. Genus assignments to four most abundant phyla are shown on the left side of the image. Sample kHLT07 lacking members of Bacteroidetes is highlighted.

