
Figure 2.
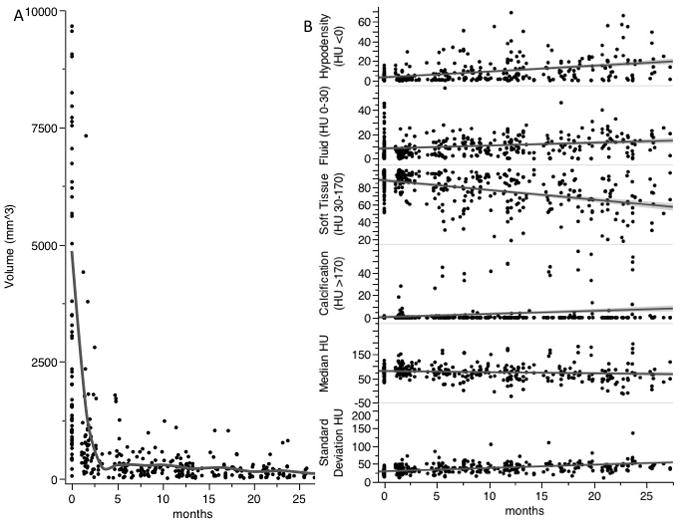
Lymph node CT characteristics over time from date of radiation therapy completion. A) Node size in mm3, fitted cubic spline to visualize trend (grey line). B) Node proportion of HU stratified components (% nodal volume-y axis) and node median HU and standard deviation (HU-y axis) over time. Best fit line to visualize trend (grey lines).