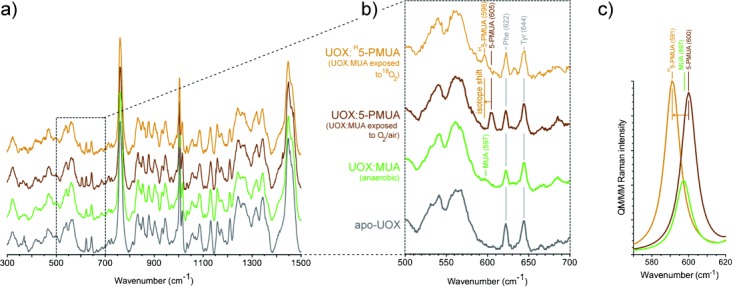
Figure 3.

In crystallo Raman spectroscopic and QM/MM validation of MUA peroxidation. a) Raman spectra of apo-UOX (grey), anaerobic UOX:MUA (green), UOX:5-PMUA (brown), and UOX:H5-PMUA crystals (orange). H5-PMUA (H for heavy) refers to MUA reacted with 18O2. b) Close-up of the 500–700 cm−1 spectral region. c) QM/MM Raman spectrum in the 570–620 cm−1 region for MUA dianion (green), 5-PMUA monoanion (brown), and H5-PMUA monoanion (orange) at the MP2/6-31+G* level of theory. A band at 600 cm−1 (experimental 605 cm−1) is predicted for 5-PMUA. It is downshifted by −9 cm−1 (experimental −9 cm−1) in the presence of 18O peroxide oxygen atoms. A band at 597 cm−1 (experimental 597 cm−1) of lower intensity compared to the “peroxide signature band” is predicted for MUA.
