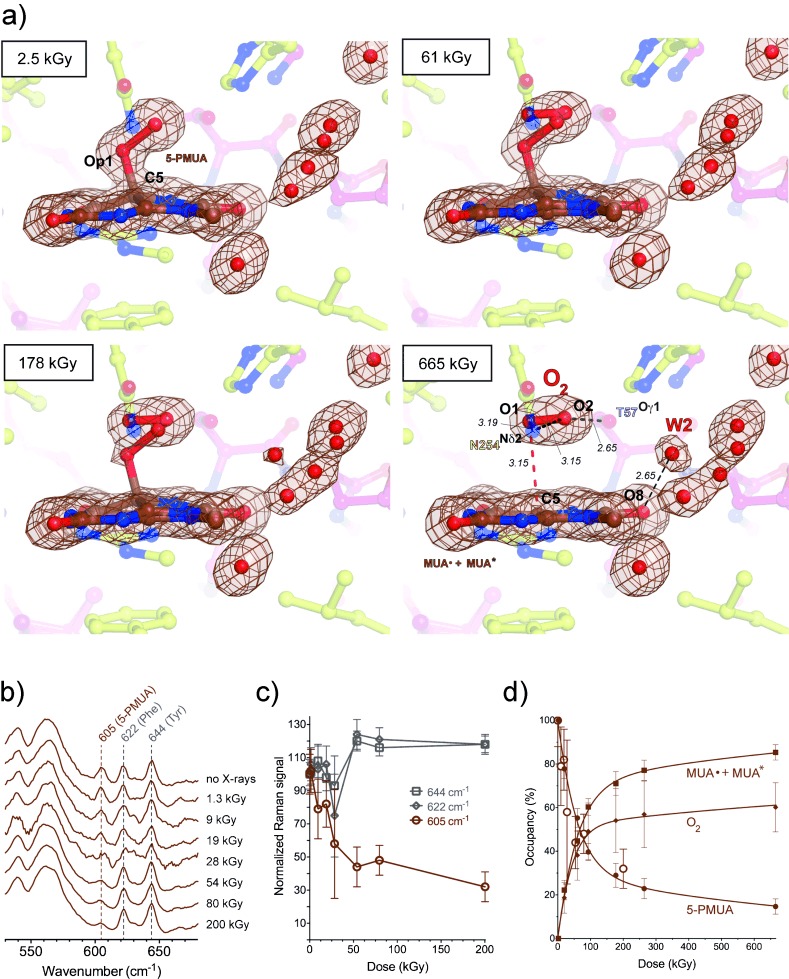
Figure 4.

Peroxide radiolysis. a) Snapshots of UOX:5-PMUA at different X-ray doses. 2 m Fo−D Fc electron density contoured at 1σ level is shown in brown for the organic moieties and solvent molecules in close proximity. Distances are in Å. Upon C5-Op1 rupture, dioxygen is trapped above the ensuing planar moiety.; b) In crystallo Raman spectroscopy shows a dose-dependent decrease of the 605 cm−1 5-PMUA “fingerprint band” band; c) Decrease of Raman intensity is specific for the 605 cm−1 band. Two-tailed p-value analysis indicates a significant dose correlation for this band (p-value=0.0022), while the 622 cm−1 and 644 cm−1 bands assigned to Phe and Tyr, respectively,[17] are unaffected. Local scaling was carried out using the 565 cm−1 band. d) 5-PMUA decay is biphasic, thus indicating a mechanism of peroxide regeneration. 5-PMUA occupancies from crystallographic refinement are shown as circles. Open circles are 5-PMUA occupancies derived from the integration of the Raman band at 605 cm−1 (same as in panel c). O2 and (MUA.+MUA*, see Eq. (1) in the main text) occupancies are shown as diamonds and squares, respectively. Lines are the kinetic fit according to Eq. (1) of the main text. Kinetic constants are k1=11.28±0.36 MGy−1, k2=0.071±0.009 MGy−1 occupancy−1, k3=4.06±0.83 MGy−1, k4=0.12±0.03 MGy−1 occupancy−1, k5=1.56±0.37 MGy−1. See also Figure S10 for 5-PIU decay and its kinetic fit.
