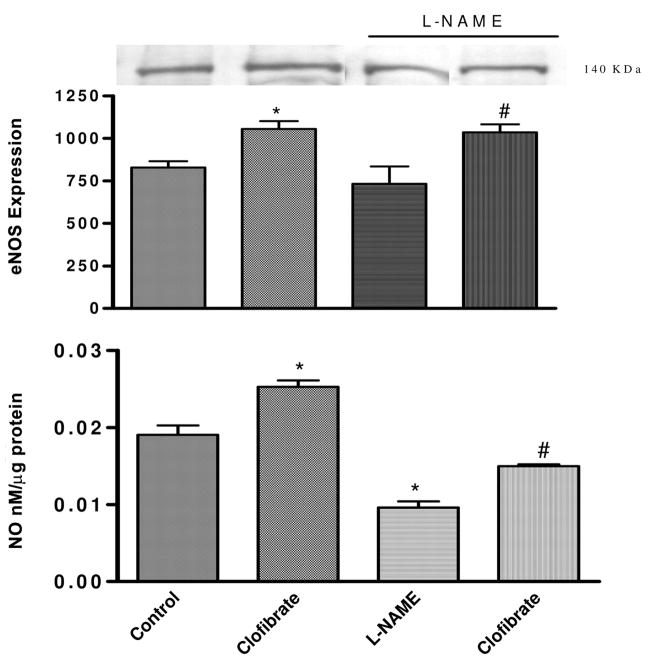
Fig. 3.
Effects of inhibition of NO production by L-NAME (100 μM) on clofibrate (10 μM)-induced production of NO and eNOS expression in CMVEC. Cells were pretreated with L-NAME for 15 min before exposure to clofibrate for 4 h. Following incubation, media were collected, cells were collected in lysis buffer for the determination of NO by Griess assay, and cells were used for protein estimation and determination of effects of treatments on eNOS expression using specific antibody for eNOS. The blot is a representative of three replicate blots, and the blots were quantified using ImageQuant and expressed as an arbitrary unit. NO results are expressed as nanomolar per microgram of protein following correction for protein and presented as mean ± S.E.M. (*, compared with control; #, compared with L-NAME; p < 0.05, n = 4–5, ANOVA).

