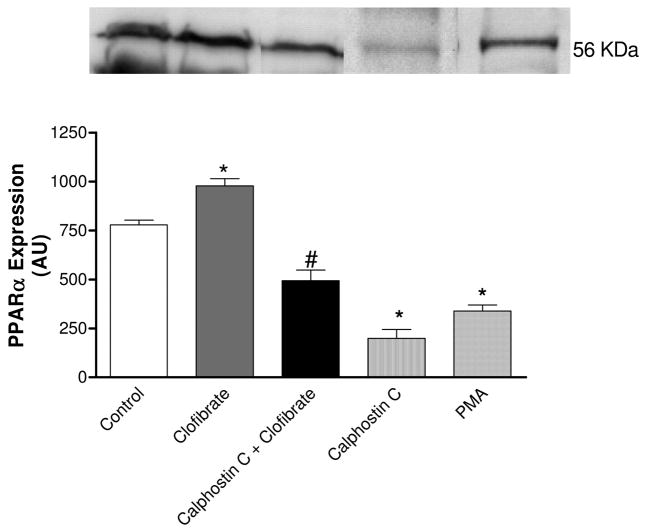
Fig. 7.
Effects of PKC activator PMA (1 μM) or inhibitor calphostin C (1 μM) on PPAPα expression and effect of PKC inhibition on clofibrate (10 μM)-induced increase in PPARα expression in CMVEC. The blot shown is a representative of three replicate blots, quantified using ImageQuant and expressed as an arbitrary unit. The results are presented as mean ± S.E.M. (*, compared with control; #, compared with calphostin C and clofibrate; p < 0.05, n = 5, ANOVA).

