
Figure 1.
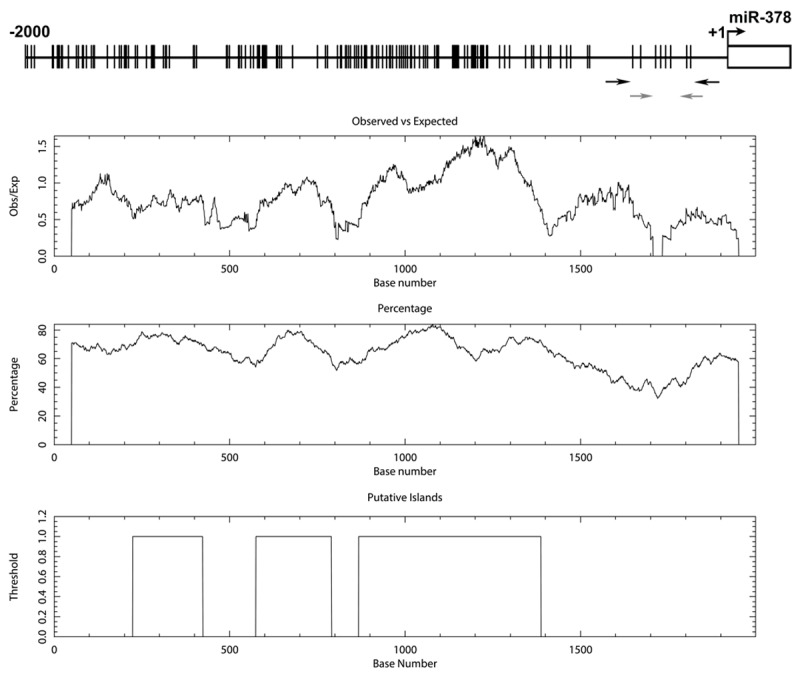
Bioinformatics analysis of the miR-378 5’-flanking region on chromosome 5. The vertical lines on the top horizontal line indicate the cytosine resides of CpGs. Numbers in the top panel represent nucleotide positions from miR-378. The rectangle indicates the position of the sequence encoding mature miR-378. The black arrows indicate the locations of primers used for bisulfite sequencing analysis, and the gray arrows indicate the locations of primers used for RQ-MSP analysis. Second panel represents the distribution of observed/expected ratios of CpG dinucleotides; third panel plots the GC content as a percentage of the total; bottom panel represents the putative 3 CpG islands within the -2.0 kb of analyzed sequence.