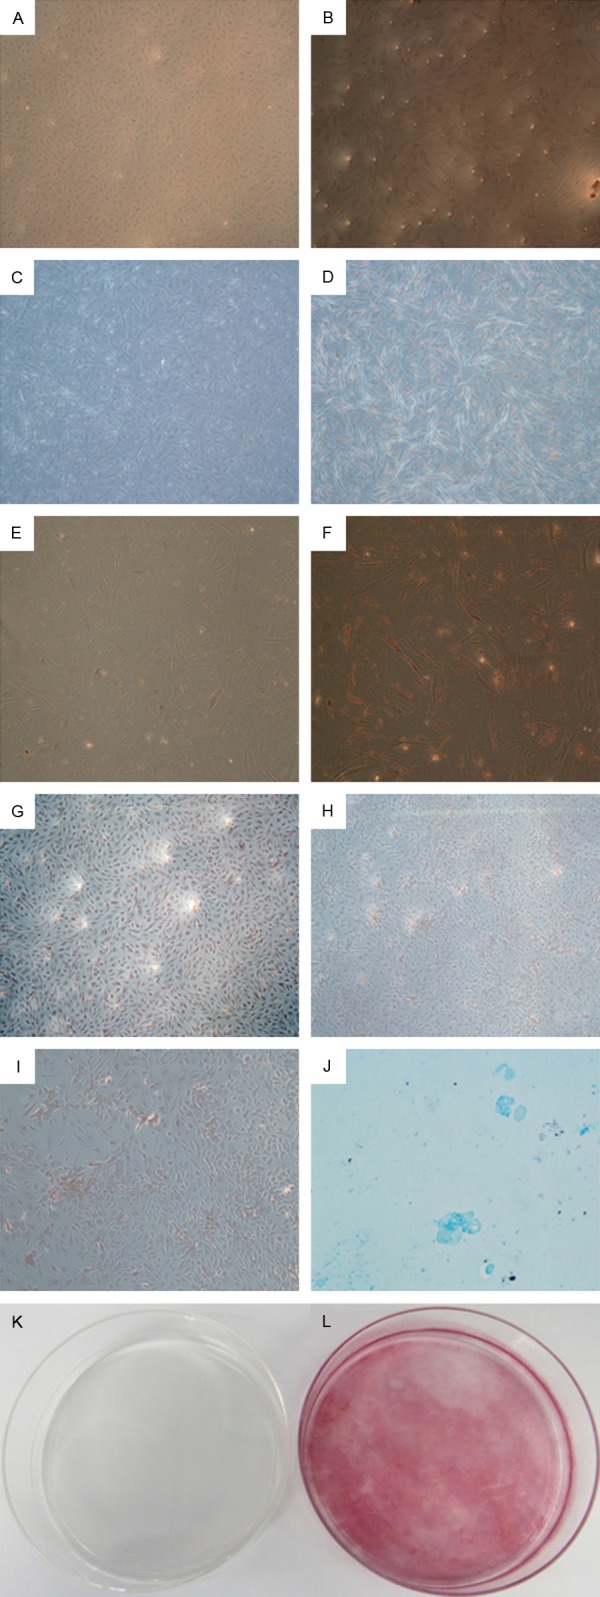
Figure 4.

Multi-lineage differentiation potential of BMSCs. A-F: Adipogenic differentiation of BMSCs. Lipid droplets formed only when BMSCs were cultured in adipogenic medium (B, D, F) compared with complete medium (A, C, E), as shown by Oil red O staining. Magnification ×50 (A, B), ×100 (C, D), ×200 (E, F). G-L: Mineralization in osteogenic differentiation of BMSCs. Calcium nodules formed only when BMSCs were cultured in osteogenic medium (H, I, L) compared with complete medium (G, K), as indicated by Alizarin red staining. Magnification ×50 (G, H), ×100 (I), ×1 (K, L). K: Chondrogenic differentiation of BMSC: cell pellet of BMSCs expressed proteoglycan as indicated by positive for Alcian blue staining. Magnification ×200.
